Download
1 / 15
150 likes | 316 Views
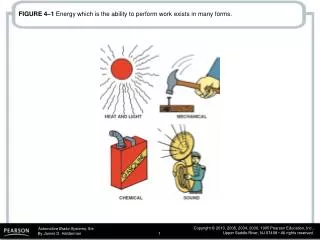
FIGURE 4–1 Energy which is the ability to perform work exists in many forms. FIGURE 4–2 Kinetic energy increases in direct proportion to the weight of the vehicle. FIGURE 4–3 Kinetic energy increases as the square of the of any increase in vehicle speed.

E N D
FIGURE 4–1 Energy which is the ability to perform work exists in many forms.
FIGURE 4–2 Kinetic energy increases in direct proportion to the weight of the vehicle.
FIGURE 4–3 Kinetic energy increases as the square of the of any increase in vehicle speed.
FIGURE 4–4 Inertia creates weight transfer that requires the front brakes to provide most of the braking force.
FIGURE 4–5 Front wheel drive vehicles have most of their weight over the front wheels.
FIGURE 4–6 A first-class lever increases force and changes the direction of the force.
FIGURE 4–7 A second class lever increases the force in the same direction as the applied force.
FIGURE 4–8 A third-class lever reduces force but increases the speed and travel of the resulting work.
FIGURE 4–9 A brake pedal assembly is a second-class lever design that provides a 5 to 1 mechanical advantage.
FIGURE 4–10 The coefficient of friction in this example is 0.5.
FIGURE 4–11 The type of friction material affects the coefficient of friction which is just 0.05 in this example.
FIGURE 4–12 The static coefficient of friction of an object at test is higher than the kinetic (dynamic) friction coefficient once in motion.
FIGURE 4–13 Mechanical fade occurs when the brake drums become so hot that they expand away from the brake lining.
FIGURE 4–14 Some heat increases the coefficient of friction but too much heat can cause it to drop off sharply.
FIGURE 4–15 One cause of GAS brake fade occurs when the phenolic resin, a part of the friction material, gets so hot that it vaporizes. The vaporized gas from the disc brake pads gets between the rotor (disc) and the friction pad. Because the friction pad is no longer in contact with the rotor, no additional braking force is possible.


![Falling in Love with Forms [BlendConf 2014]](https://cdn4.slideserve.com/7566422/falling-in-love-with-forms-dt.jpg)
![Falling in Love With Forms [Breaking Development Nashville 2015]](https://cdn4.slideserve.com/7566897/falling-in-love-with-forms-dt.jpg)
![Falling in Love with Forms [Øredev 2015]](https://cdn4.slideserve.com/7567052/falling-in-love-with-forms-dt.jpg)