Download
1 / 50
500 likes | 743 Views
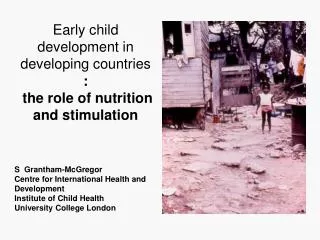
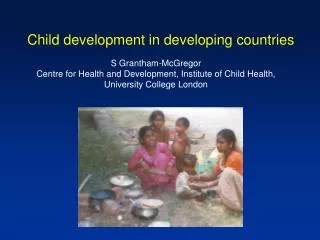
Child development in developing countries. S Grantham-McGregor Centre for Health and Development, Institute of Child Health, University College London.

E N D
Child development in developing countries S Grantham-McGregor Centre for Health and Development, Institute of Child Health, University College London
The Lancet series: The development of children <5 yrs in developing countries(Grantham-McGregor et al 2007, Walker et al 2007,P Engle et al 2007) • The size of the problem • The causes International Child Development Steering Group:S Grantham-McGregor, P Engle, M Black, J Meeks Gardner, B Lozoff, T Wachs, S Walker, Paper 1&2, Y B Cheung, S Cueto, P Glewwe, Richter, B Strupp, J Meeks Gardner, GA Wasserman, E Pollitt, JA Carter
Overall Aims of Lancet Series To increase awareness of the problem of poor development in early childhood in low resource countries. To make the promotion of optimal child development an international priority. Bring together academics from many different disciplines from universities, UN agencies and NGOs to develop a consensus for action.
Aims of paper Estimate the size of the problem Identify the location of affected children Estimate cost and consequences Factors causing poor development
Why focus on early childhood? • Brain development most rapid and vulnerable from conception to 5 years • Insults and interventions can have lasting effects • Interventions are more cost effective than at other ages • Cognitive ability & behaviour on entry school progress
Domains of Child Development Sensory-motor Cognitive-language Social-emotional
Major problem with estimating numbers of affected children • Insufficient data on early cognitive ability for most developing countries to estimate prevalence
Need to use risk factors as indicators of poor child development to assess prevalence • 1. Stunting (<-2SD) • 2. Poverty<$1 per day (adjusted for purchasing power by country, World Bank 2005)
Requirements of indicators • Standardised measures across countries • Global data available • Relevant in most countries • Consistently related to poor child development and school achievement in developing countries ?
Stunting in children > 28 studies X-sectional associations between stunting & poor cognition or school achievement
Longitudinal data essential Jamaica Walker South AfricanRichter, Norris Phillipines Cebu study Uganda dataFamily Life Study Brazil Victora, Barros, Damiani, Lima, Gigante, Horta Peru Berkman, Lescano Guatemala Martorell
Cognitive or schooling deficits associated with moderate stunting <3yrs in 7 longitudinal studies SD scores 15yrs 7yrs 7yrs 18yrs 9yrs 17-18yrs 18-25yrs Philippines S Africa Indonesia Brazil Peru Jamaica Guatemala
Conclusion Reasonable to use stunting as an indicator of poor child development
Poverty <1 per day >60 X-sectional studies showed associations with wealth and school achievement or cognition
Later cognitive deficits associated with being in the lowest wealth quintile <3yrs in 5 longitudinal studies (SD scores) 15yrs 7yrs 7yrs 18yrs 18-26yrs Philippines Indonesia S Africa Brazil^ Guatemala* ^Grades attained *boys
Conclusion Reasonable to use poverty as an indicator of poor child development
Millions of children < 5y not fulfilling their potential in development (WHO, 2006; UNICEF 2006) 219m (39% of children <5y) 156m 126m Stunted + Poverty not stunted Stunted Poverty Disadvantaged
Limitations • Other risk factors not included • Cut off for poverty uncertain • Estimate for numbers of children based on poverty rates for total population Underestimate
Loss of yearly adult income • Deficit in grades attained (Brazil) 2. Deficit in learning per grade (Phillipines, Jamaica) 3. Estimate total deficit (1+2) 4. Using estimate of 9% loss in income per grade (53 countries Psacharopoulos 2004, Duflo 2001) 20 % loss of yearly adult income
Conclusion Loss of children’s potential is an enormous problem affecting >200million It has economic and social costs both to individual and nations
Risk factors affecting child development in low resource countries
Selection criteria • Modifiable by interventions or public policy • Affect large number of children less than 5 years in developing countries • Risks with little information from developing countries excluded
Four main risks • Chronic undernutrition leading to stunting • Iodine deficiency • Iron deficiency anemia (IDA) • Inadequate cognitive stimulation
Deficits at 17 yrs in Jamaican children stunted before 2 yrs IQ, vocabulary, cognition school achievement /drop out fine motor depression, anxiety, attention deficit, self esteem, hyperactive, oppositional Walker et al 2005, 2006
Inadequate cognitive stimulation or learning opportunities A biological insult
Mean Corticosterone Levels Pre & Post Stress in Non-handled, Handled and Maternally-separated Rats (n= 8 per group) µg/dl Pre- stress Plotsky & Meaney 1993 Time (min)
Intervention studies • 15 of 16 intervention studies providing cognitive stimulation show benefits to development • Centre based or home based: Effect size 0.5-1 SD Lancet paper2
110 weekly 106 102 98 94 Pre-test Post-test Effects of visiting frequency in disadvantaged children DQ fortnightly monthly no visits Powell & Grantham-McGregor, 1989
Cognitive ability at 7 years by duration of center based intervention; Colombia Cognitive ability 0 1 2 3 4 Periods of intervention McKay et al, 1979
Interventions with stunted children DQ non-stunted control both Rxs stimulated supplemented Grantham-McGregor et al, 1991
Sustained:Benefits at 17-18 Years From Early Childhood Stimulation in Stunted Children P value ** ** * * ** ** *** *** ns ns ns ns Standard scores *p<.1; **p<.05, ***p<.01 Walker et al, 2005
Sustained: Benefits at 17-18 years from stimulation in early childhood in stunted children P value ** ** ** ns ** ns ns * Standard scores *p<.1; **p<.05 Walker et al unpublished
Summary of stimulation studies • Consistent concurrent benefits to child’s DQ • Benefits greater in : • more intense, longer, include nutrition • Sustainable cognitive,education and mental health benefits at 17-18yrs
Conclusion: Good evidence for 4 main risks • Chronic undernutrition leading to stunting • Iodine deficiency • Iron deficiency • Inadequate cognitive stimulation
Other risk factors • Risk factors with consistent epidemiological evidence showing association with development • Lack of interventions with evaluation of effectiveness
Other risks identified Small for gestational age Malaria Maternal depression Exposure to violence Exposure to environmental toxins
Multiple risks in early childhood and achievement scores in adolescence Risk factors Gorman and Pollitt, 1996
Mean Developmental Quotients on Griffiths Test DQ Urban middle class n=78 Urban poor n=268 Age months (Walker et al)
Maternal stress/ depression Low education Poor care and home stimulation Poor school achievement Poor hygiene, feeding practices, care-seeking Poverty Poor cognitive, socio-emotional development Poor sanitation, Food insecurity Stunting & wasting, iodine & iron deficiency, diarrhoea,infections
national economy
Countries with highest % of children < 5y who are stunted in Latin America & the Caribbean (UNICEF 2006) %
Types of evidence • Randomised trials and intervention studies • Prospective cohort studies • Associational studies (with control for confounders)
Vocabulary scores by SES quartiles in 36 to 72 month old children EquadorPaxson and Shady2005 age in months
Why health services? • Only service accessing children in first 3 years • Already has an infrastructure • Development an integral part of health • Poor health & nutrition poor development • Mothers enjoy and can facilitate other activities • We cannot wait for new services
Why psychosocial stimulation interventions? • Malnourished children do not catch up with nutrition alone • Stimulation changes brain function in animals • Adoption studies show vast improvement • In USA disadvantaged children have shown sustained benefits
IQ scores of stunted and non-stunted Jamaican children from age 9-24 mo to 18 y 0.8 0.6 Non-stunted 0.4 0.2 SD score 0 -0.2 Stunted. -0.4 -0.6 Griffiths on Griffiths (33-48 mo) Stanford- WISC-R (11-12 y) WAIS (17-18 y) Enrollment (9-24 mo) Binet (7-8 y) Walker et al 2005
7 longitudinal studies of stunting <3yrs & later function Country Follow-up age Outcome Indonesia 7 cognitive test S Africa 7 cognitive test Peru 9 IQ Philippines 15 schooling Jamaica 17-18 schooling, IQ Brazil 18 attained grades Guatemala 18-26 schooling, IQ