
Analysis of Health Insurance Premium Distribution Trends in 2012
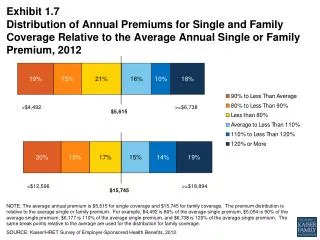
This exhibit displays the distribution of annual premiums for single and family health coverage in 2012 relative to the average annual premiums. The data shows the percentages above and below the average premium for both single and family coverage. It highlights how premiums compare to the average rates, illustrating varying cost brackets. This information is sourced from the Kaiser/HRET Survey of Employer-Sponsored Health Benefits in 2012.

Analysis of Health Insurance Premium Distribution Trends in 2012
E N D
Presentation Transcript
Exhibit 1.7 Distribution of Annual Premiums for Single and Family Coverage Relative to the Average Annual Single or Family Premium, 2012 <$4,492 >=$6,738 $5,615 <$12,596 >=$18,894 $15,745 NOTE: The average annual premium is $5,615 for single coverage and $15,745 for family coverage. The premium distribution is relative to the average single or family premium. For example, $4,492 is 80% of the average single premium, $5,054 is 90% of the average single premium, $6,177 is 110% of the average single premium, and $6,738 is 120% of the average single premium. The same break points relative to the average are used for the distribution for family coverage. SOURCE: Kaiser/HRET Survey of Employer-Sponsored Health Benefits, 2012.