Download
1 / 1
10 likes | 328 Views
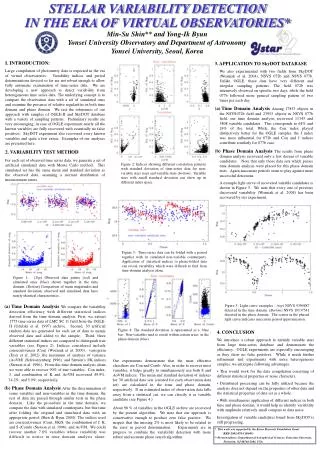
Figure 2: Indices showing different correlation patterns with standard deviation of time-series data for non-variable stars ( top ) and variable stars ( bottom ). Variable stars with small standard deviation can show up in different index space.

E N D
Figure 2: Indices showing different correlation patterns with standard deviation of time-series data for non-variable stars (top) and variable stars (bottom). Variable stars with small standard deviation can show up in different index space. Figure 1: (Top) Observed data points (red) and simulated ones (blue) shown together in the time domain. (Bottom) Comparison of mean magnitudes and standard deviation; observed and simulated data have nearly identical characteristics. Figure 5: Light curve examples : (top) NSVS 9380887 detected in the time domain. (Bottom) NSVS 10137541 detected in the phase domain. The scatter in the phased light curve indicates inaccurate period approximation. STELLAR VARIABILITY DETECTION IN THE ERA OF VIRTUAL OBSERVATORIES* Min-Su Shin** and Yong-Ik Byun Yonsei University Observatory and Department of Astronomy Yonsei University, Seoul, Korea I. INTRODUCTION: Large compilation of photometry data is expected in the era of virtual observatories. Variability indices and period determinations devised so far are not robust enough to allow fully automatic examination of time-series data. We are developing a new approach to detect variability from heterogeneous time series data. The underlying concept is to compare the observation data with a set of simulated ones and examine the presence of relative regularities in both time domain and phase domain. We test the robustness of our approach with samples of OGLE-II and SkyDOT database with a variety of sampling patterns. Preliminary results are very encouraging; in case of OGLE experiment nearly all the known variables are fully recovered with essentially no false positives. SkyDOT experiment also recovered every known variables and quite a few extras. Examples of our analyses are presented here. 2. VARIABILITY TEST METHOD For each set of observed time series data, we generate a set of artificial simulated data with Monte Carlo method. This simulated set has the same mean and standard deviation as the observed data, assuming a normal distribution of measurement errors. • 3. APPLICATION TO SkyDOT DATABASE • We also experimented with two fields from SkyDOT (Wozniak et al. 2004), NSVS 072b and NSVS 077b. Unlike OGLE, these data have very different and irregular sampling patterns. The field 072b was intensively observed on specific two days, while the field 077b followed more general sampling pattern of two times per each day. • Time Domain Analysis Among 17853 objects in the NSVS072b field and 23955 objects in NSVS 077b field, our time domain analysis recovered 11343 and 5808 variable candidates. This corresponds to 64% and 24% of the total. While the Con index played distinctively better for the OGLE samples, the J index was most influential for 072b and Con and J indices contribute similarly for 077b case. • (b) Phase Domain AnalysisThe results from phase domain analysis recovered only a few dozens of variable candidates. Note that only those data sets which passes time domain analysis were placed for this phase domain tests. Again inaccurate periods seem to play against more successful detections. • A example light curve of recovered variable candidates is shown in Figure 5. We note that every one of previous discovered variability (Wozniak et al. 2004) has been recovered by our experiment. Figure 3: Time-series data can be folded with a period together with its simulated non-variable counterparts. Application of statistical indices to phase-folded data can reveal variability which were difficult to find from time-domain analysis alone. • Time Domain Analysis We compare the variability detection efficiency with different statistical indices derived from the time domain analysis. First, we extract 1775 time-series data of LMC SC 11 field from the OGLE-II (Udalski et al. 1997) archive. Second, 30 artificial random data are generated for each set of data to mimic observed data and added to the sample. Third, three different statistical indices are compared to distinguish true variables (see Figure 2). Indices considered include consecutiveness (Con) (Wozniak et al. 2000), variogram (Eyer et al. 2002), the maximum of analysis of variance (AoVM) (Schwarzenberg 1996), and Stetson’s J/K indices (Stetson et al. 1996). From this time domain analysis alone, we were able to recover 90% of true variables. Con index, J, and combination of K and AoVM recovered 49.9%, • 34.2%, and 5.9%, respectively. • (b) Phase Domain Analysis After the discrimination of some variables and non-variables in the time domain, the rest of data are passed through similar tests in the phase domain. Like the procedure in the time domain, we compare the data with simulated counterparts, but this time after folding the original and simulated data with an appropriate period (Shin & Byun 2004). The indices used are consecutiveness (Con), J/K/S, the combination of J, K, and S (Comb) (Stetson et al. 1996), and AoVM. We could recover another 7.8% variables whose variability was difficult to notice in time domain analysis alone. Figure 4: The standard deviation is represented as a blue bar. Non-variables tend to reside within certain areas in the phase domain (blue). 4. CONCLUSION We introduce a robust approach to identify variable stars from large time-series database and demonstrate the efficiency. OGLE experiments are especially encouraging as they show no false positives. While it needs further refinement and experiments with more heterogeneous samples, we anticipate following advantages. • This would work for the data compilation consisting of different statistical properties or noise characters. • Distributed processing can be fully utilized because the analysis does not depend on the properties of other data and the statistical properties of data set as a whole. • With simultaneous application of different indices in both time and phase domain, it would help us identify variability with amplitude relatively small compare to data noise. Investigation of variable candidates found from SkyDOT is still progressing. Our experiments demonstrate that the most effective classifiers are Con and Comb. Also, in order to recover most variables, it helps greatly to simultaneously use both S and AoVM indices. The mean and standard deviation of indexes for 30 artificial data sets (created for each observation data set) are calculated in the time and phase domain, respectively. If an estimated index of observation data falls away from a statistical cut, we can classify it as variable candidate (see Figure 4.) About 98 % of variables in the OGLE archive are recovered by the present algorithm. We note that our approach is conservative enough to produce zero false positive. We suspect that the missing 2% is most likely to be related to the error in period determination. Experiments are in progress to combine the variability detection with more robust and accurate phase search algorithm. * This work was supported by the Korea Research Foundation Grant (KRF-2002-070-C00045) **Presentaddress: Department of Astrophysical Sciences, Princeton University, Princeton, NJ 08544-1001, USA