Download

1 / 33
330 likes | 553 Views
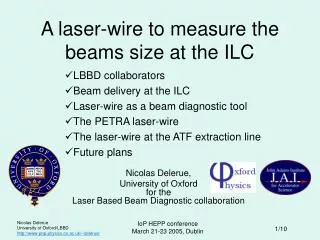
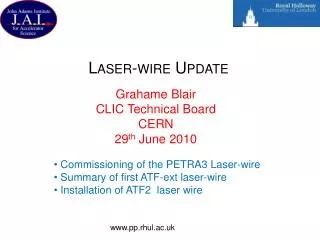
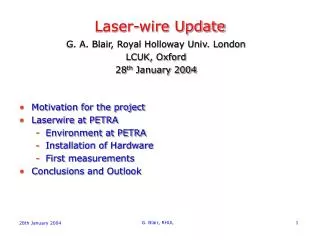
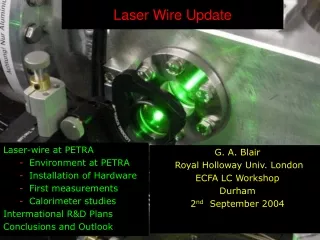
The Laser System at PETRA Wire. Motivation for the project Laserwire at PETRA Environment at PETRA Installation of Hardware First measurements Conclusions and Outlook . G. A. Blair, Royal Holloway Univ. London ALCPG Workshop, SLAC 8 th January 2004 Systems+Instrumentation Session .

E N D
The Laser System at PETRA Wire • Motivation for the project • Laserwire at PETRA • Environment at PETRA • Installation of Hardware • First measurements • Conclusions and Outlook G. A. Blair, Royal Holloway Univ. London ALCPG Workshop, SLAC 8th January 2004 Systems+Instrumentation Session G. Blair, RHUL
Motivation • Maximise Luminosity performance of Linear Collider • Control of transverse beam size and emittance in the Beam Delivery System (BDS) and at the Interaction Point (IP) • Conventional techniques (wirescanner) at their operational limit • Development of standard diagnostic tool for LC and LC Test Facility operation based on optical scattering structures Laserwire, (later? Laser-Interferometer) • Features • Resolution error smaller than 10% • Fast (intra-train) scanning • Non-destructive for electron beam • Resistant to high power electron beam G. Blair, RHUL
Trans: 10-100 m Long: ~200 m Trans: 10-100 nm Trans.+Long. Profiles G. Blair, RHUL
LC Layout and Parameters G. Blair, RHUL
Optical Scattering Structures • Scanning of finely focused laser beam through electron beam • Detection of Compton photons (or degraded electrons) as function of relative laser beam position • Challenges • Produce scattering structure smaller than beam size • Provide fast scanning mechanism • Achieve efficient signal detection / background suppression G. Blair, RHUL
Laserwire for PETRA PETRA parameter • Positron Electron Tandem Ring Accelerator • Injector for HERA, upgrade to synchrotron light source • Long free straight section • Easy installation of hardware due to existing access pipe and hut outside tunnel area • Q-switch Nd:YAG with SHG • From CERN LEP polarimeter • Trans Mode: large M2 ~9 • Long Mode: stability ± 20%, beating ps substructure • Homegrown timing unit for external triggering Laser parameter G. Blair, RHUL
Laserwire for PETRA G. Blair, RHUL
Signal and Backgrounds • Signal: Compton scattering • Background sources: • Synchrotron radiation • Cosmic rays • Bremsstrahlung • Simulation with Geant4 plus tool kits with realistic setup G. Blair, RHUL
Setup at PETRA G. Blair, RHUL
Installation at PETRA G. Blair, RHUL
Installation at PETRA G. Blair, RHUL
Lab Measurements at RHUL G. Blair, RHUL
Installation at PETRA G. Blair, RHUL
Detector • Requirements for detector material • short decay time (avoid pile up) • short radiation length • small Moliere radius • Cuboid detector crystals made of PbWO4 • 3x3 matrix of 18x18x150 mm crystals • Energy resolution better than 5% G. Blair, RHUL
Detector Calibration • Detector studies with DESY II testbeam • Beamline with electrons with energy from 450 MeV to 6 GeV • Ten detector crystals were calibrated using a single PMT • Combination of nine crystals in matrix • Resolution • High intrinsic resolution • Full matrix less good G. Blair, RHUL
The Laser • The laser has been given to us by B. Dehning from CERN. It has been used at LEP to measure beam polarization • It’s a Nd:YAG Q-switched system, running with 30 Hz • pulse energy measured: 40 mJ, power: 4 MW • synchronization to PETRA beam by triggering the Q-switch Pockels-cell • transverse beam quality is modest (multimode) • measured spot size at IP: σL = (80 ± 10)μm G. Blair, RHUL
Measurement of the longitudinal Profile • The longitudinal profile has been measured with a streak camera: FESCA 200 from Hamamatsu • largest window of the camera: 500 ps with a resolution of 5 ps (fwhh) • The camera was triggered with the laser via a fast photo diode • Problem: stability of the trigger probably not better than 0.5 ns G. Blair, RHUL
Averaged Profile • Measured averaged profile: fits to gaussian with a width of 12.5 ns (as expected) G. Blair, RHUL
66 ps 60 ps Structure in the Longitudinal Profile • Example of a single shot measurement of the profile500 ps window, resolution 5 ps G. Blair, RHUL
Unfortunately, the structure is not stable • The longitudinal structure is due to longitudinal mode beating – this was expected • The beating changes from shot to shot 79 ps 30 ps G. Blair, RHUL
Laser Transverse Profile Units – number of CCD pixels G. Blair, RHUL
Laser Summary • As expected for a this type of laser, the longitudinal profile shows substructure due to mode beating • The spikes have a width of 30 to 60 ps and a distance of 60 to 80 ps • Unfortunately, the structure is not stable and changes from shot to shot • To overcome this, the laser has to be equipped with a frequency stabilized seed laser or eventually with an Etalon • Hot spots a problem G. Blair, RHUL
First Photons 31.07.03 Laseron Laseroff Calorimeter Q-switch Photodiode at IP G. Blair, RHUL
Orbit Scan • First scan with signal on scope • Then sampling of peak using ADC • Moving beam orbit up and down with vertical orbit bump • 5k counts at each orbit position • 3 min for each spectrum • 40 min for complete scan • Background with 20k counts • Mainly synchrotron radiation and bremsstrahlung • Rate changed by factor 10 • Signal rate expected at peak • 200 γs x 380 MeV avg Energy G. Blair, RHUL
Gaussian approximation of beam shape σm = (0.175 ± 0.020stat ± 0.038sys) mm Vertical beam size σe = sqrt(σm - σL ) laser σL = (40 ± 10)μm σe = (170 ± 23 ± 37) μm Result of fit sensitive to background modelling Systematic error dominated by vertical orbit jitter More measurements and understaning of bkg sources necessary Result Orbit Scan G. Blair, RHUL
Fast Scanner Operation • Next scan with remote controlled fast scanner • Orbit position stable • Scan range: ± 2.5 mrad • Scan line = range * flens= 0.625 mm (± 20%) • Change amplitude of scanner power supply (1-100V) • Take 5k counts • Record laser IP image with CCD • Move laser beam • Take 5k counts ... G. Blair, RHUL
CCD Diagnostics Position Width Total signal Scan 1 Scan 2 G. Blair, RHUL
Data and Analysis • Seven scan points recorded • 5 min / point • 40 min for full scan • Positron beam position stable within ± 40 μm • Moving low energy pedestal • No background model • Orbit stable bkg const. • Simple pedestal cut instead • Sufficient background rejection G. Blair, RHUL
New Setting 5.12.03 • Positron beam in PETRA • Beam energy: 7 GeV • Positron beam optics not as in October scans. • Bunch pattern: 14 x 1 bunch evenly filled • Low current: 7.1 mA, first bunch 0.458 mA • Bunch charge = avg. current / (reprate * Nbunches) = 3.9 nC • High current: 40.5 mA, first bunch 2.686 mA • Bunch charge = 22.3 nC • Vertical and horizontal orbit bumps to steer positron beam into laser beam • Closed symmetric bumps using four steerers • Scanning of laser beam using the fast piezo scanner G. Blair, RHUL
Results 04.12.03 Data • Gaussian approximation of beam shape σm =(68 ± 3 ± 20) μm at low current σm =(80 ± 6 ± 20) μm at high current G. Blair, RHUL
Conclusions and Outlook • Laserwire at PETRA produced first compton photons and measure vertical beam size Next steps: • Full characterisation of laser: beam size, divergence, and power (stability) with slot scans and imaging techniques • Update all readout software, merge BPM,CCD and PMT software • Do more systematic scans with the fast scanner • Go to smaller spot sizes and reduce error bars • Build second dimension scanner. • Start designing a complete laser-wire emittance measurement system for the LC BDS. G. Blair, RHUL
Collaborators • DESY • BESSY (Thanks to T. Kamps for many of these slides) • UK: RHUL, UCL, RAL, (Oxford). • CERN: (Laser, plus collaboration) Close contact with: • SLAC • KEK G. Blair, RHUL
People Thanks to PETRA and BKR shift crews ! K Balewski, G Blair, S Boogert, G Boorman, J Bosser, J Carter, J Frisch, Y Honda, S Hutchins, T Kamps, T Lefevre, H C Lewin, F Poirier, I N Ross, M Ross, H Sakai, N Sasao, P Schmüser, S Schreiber, J Urakawa, M Wendt, K Wittenburg, G. Blair, RHUL