Download
1 / 38
390 likes | 635 Views
Digging Into Student Data Oct. 24, 2006. Plan for Today. 4:10-4:25 Introduction to Digging Deeper 4:25-4:55 Looking at Student Work 4:55-5:45 Single Problem Assessment Protocol 5:45-5:55 Break 5:55-6:15 A Sample Data Overview 6:15-7:00 School Team Work.

E N D
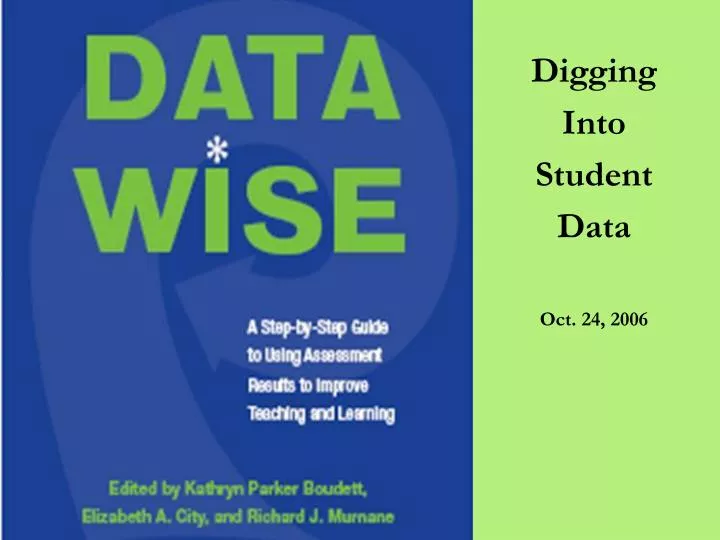
Digging Into Student Data Oct. 24, 2006
Plan for Today 4:10-4:25 Introduction to Digging Deeper 4:25-4:55 Looking at Student Work 4:55-5:45 Single Problem Assessment Protocol 5:45-5:55 Break 5:55-6:15 A Sample Data Overview 6:15-7:00 School Team Work
What are we digging for? Goal To identify a learner-centered problem that we want to work together to solve
Steps of the Process • Share a Data Overview with faculty • Begin to think about how to frame a learner-centered problem • Start a conversation about what else we need to know to define the problem more precisely • Collect the data and state the problem
Two Approaches to “Digging” • Look closely at a single data source • Explore multiple data sources
1. Look carefully at a single data source • Choose a source that will help you really understand student thinking • Allow for challenging of assumptions
Why start with a single data source? • Help move past “stuck points” • Slow down, avoid leaping to solutions • Make the data analysis more engaging • Move beyond generalizations
2. Dig into multiple data sources • “Triangulate” on the problem • Get a more complete picture of student performance
Why dig into multiple sources? • Develop a shared understanding of the knowledge and skills students need • Develop a common language • Avoid making inappropriate inferences from test results
Questions for Reflection • Do you have a solid understanding of why students are performing as they are? • Can you state the learner-centered problem in a way that focuses on the knowledge and skills you want students to have? • Is your understanding of the problem supported by multiple sources of data? • If you solve this problem, will it help you meet your larger goals for students?
Looking at Student WorkSteve Seidel A306 Data Wise: Step-by-Step Guide for Using Assessment Results to Improve Teaching & Learning Harvard Graduate School of EducationOctober 24, 2006
Thinking of student work as “raw” data… • What to do with that data? • How to make sense of it? • How to use those insights to improve instruction?
Questions for a Pair/Share: • How have you encountered “looking at student work?” • What worked and what didn’t work about your experiences in structured conversations about student work? • What questions did those experiences leave you with?
Five things you need to use that data well: • Collaboration • Clarity of purpose • A structure or method for analyzing it • A way to integrate that analysis into a larger view of what is going on in your classroom, school, or district • Follow-up and follow-through
A Brief History of Looking at Student Work Before 1985… • The Prospect Center and Descriptive Review Processes • Literacy “Digs” • Teacher’s Seminars on Children’s Thinking 1985 to 1990… • Portfolios, Process-folios…but where’s the assessment? 1990 to now… • The Massachusetts School Reform Act of 1993 • Coaches, Coaching, and Looking at Student Work: Required, then rejected
Some lessons learned over the years from looking at student work: • You can gain insights in many realms – about learners, the learning environment, the nature of work on a particular task. • You can’t do it alone. (Or, at least, you are much better off doing it with other people.) • You need a structure that serves your purpose. • Look first (and last) at work of students who you feel are not having satisfactory learning experiences in your classroom or school.
The Single Problem Assessment ProtocolDeveloped for Data Wise □ Steve Seidel • The Steps of the Protocol (approximately 35 minutes) • Read the problem and work out your own answer to it. Keep some notes on your thinking process. (5 minutes) • Share observations about the problem and your own problem-solving process. Specifically, what was striking to you about the problem and your efforts to solve it? (5-7 minutes) • Look at the student work (read silently). (3 minutes) • Describe what this student did and how she/he thought about the problem. (5 minutes) • Identify and share questions that have come up for you about this student’s grasp of the mathematical content of this question, based on your examination of this work so far. (5 minutes) • Share ideas about the implications for teaching and learning that you draw from your examination of this work. (10 minutes)
Looking at student work in the context of the Data Wise process
Franklin High School Data Overview: Mathematics Instructional Leadership Team October 2006 Meeting
Purpose of today’s meeting To start a conversation about math performance at Franklin by looking at how our 10th graders performed on the state test last spring
Agenda • 3:00-3:25 Overview of presentation/discussion • 3:25-3:45 Breakout to brainstorm questions • 3:45-4:00 Reconvene to discuss next steps
Which students are failing? By program…
Which students are failing? By race/ethnicity…
What questions does this overview raise? Brainstorm in groups:
For Nov 3: Data Overview • Comprehensive picture of your school’s data • Intended to be shared with your faculty • Opportunity to address adaptive challenges • Opportunity to develop technical skills
Data Overview: Steps 7-11 • Decide which charts to share • Identify additional data • Produce charts of this data • Plan how to structure discussion • Create PowerPoint presentation