Download
1 / 17
170 likes | 293 Views
Supporting Information for Publication SAR405838 : An optimized inhibitor of MDM2-p53 interaction that induces complete and durable tumor regression

E N D
Supporting Information for Publication SAR405838: An optimized inhibitor of MDM2-p53 interaction that induces complete and durable tumor regression ShaomengWang+*, Wei Sun+, Yujun Zhao+, Donna McEachern+, Isabelle Meaux#, CédricBarrière#, Jeanne Stuckey+, Jennifer Meagher+, LongchuanBai+, Liu Liu+, Cassandra Gianna Hoffman-Luca+, Jianfeng Lu+, SanjeevShangary+, Shanghai Yu+, Denzil Bernard+, Odette Dos-Santos#, Laurent Besret#, StéphaneGuerif#, Pascal Pannier#, Dimitri Gorge-Bernat# and Laurent Debussche#
SI Table S1. Crystallography Data Collection and Refinement Statistics for the co-crystal structure of . 1Statistics for highest resolution bin of reflections in parentheses. 2Rsym =hj l Ihj-<Ih> l /hjIhj, where Ihj is the intensity of observation j of reflection h and <Ih> is the mean intensity for multiply recorded reflections. 3Intensity signal-to-noise ratio. 4Completeness of the unique diffraction data. 5R-factor = h I IFoI – IFcI I / hIFoI, where Fo and Fc are the observed and calculated structure factor amplitudes for reflection h. 6Rfree is calculated against a 10% random sampling of the reflections that were removed before structure refinement. 7Root mean square deviation of bond lengths and bond angles. 8 Chen et al. (2010) MolProbity: all-atom structure validation for macromolecular crystallography.ActaCrystallographica D66:12-21. Listed in order by chain (Chain A – E). 9 Real Space R (RSR) values. Listed in order by chain (Chain A – E). 10 Real Space Correlation Coefficients (RSCC). Listed in order by chain (Chain A – E).
SI Table S2. Binding affinities of SAR405838(MI-77301), as well as reference compounds to different MDM2 protein constructs, as determined using competitive FP-based binding assays. IC50 values were obtained from at least three independent experiments.
SI Table S3. Key pharmacokinetic parameters for SAR405838 in mice, rats and dogs with intravenous (i.v.) or oral (p.o.) administration.
SI Figure S1. Binding to MDMx (A) of MI-77301 and PMI, a dual MDM2 and MDMX inhibitory p53-mimic peptide determined by Biolayer Interferometry (BLI/OctetRED). Interferometric response of the optical sensor immobilized with MDMx was monitored upon interacting with compound with different concentrations. The KD value for MI-77301 was estimated to be >100µM. (B). Binding affinity of MI-77301 and ABT-263 to Bcl-2, determined using a competitive FP-based assay. (C). Binding affinity of MI-77301 and ABT-263 to Bcl-xL, determined using a competitive FP-based assay. (D). Binding affinity of MI-77301 and BID BH3 peptide to Mcl-1 determined using a competitive FP-based assay. (E). Binding affinity of MI-77301 and Bcl-9 peptide to β-catenin, determined using a competitive FP assays.
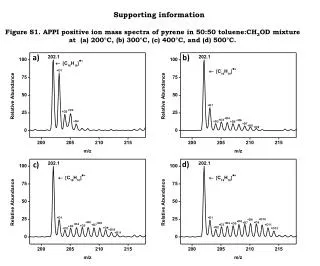
Figure S2. Chemical stability of SAR405838(MI-77301)in MeOH:H2O, CH3CN:H2O or cell culture media. Purity of the compound was determined by HPLC.
SI Figure S3. qRT-PCR Analysis of mRNA levels of p53-targeted genes, including MDM2, p21, PUMA, NOVA and BAX treated with SAR405838 (SAR), MI-219 and nutlin-3a in SJSA-1 and HCT-116 cells. p53 was included as a control. Cells were treated for 24 hrs.
SI Figure S4. Western blot analysis of accumulation of p53, MDM2, PUMA, p21 proteins and cleavage of PARP and caspase-3 induced by SAR405838 (SAR) and MI-219 in prostate cancer LNCAP and acute leukemia RS4;11 cell lines. Cells were treated with different concentrations of an inhibitor for 18 hours. RS4;11 18 h LNCaP 18 h DMSO 30 nM 100 nM 300 nM 1000 nM 3000 nM 10000 nM 100 nM 300 nM 1000 nM 3000 nM 10000 nM DMSO DMSO 30 nM 100 nM 300 nM 1000 nM 3000 nM 10000 nM 100 nM 300 nM 1000 nM 3000 nM 10000 nM DMSO SAR SAR MI-219 MI-219 p53 MDM2 PUMA p21 Cas-3 Cl Cas-3 PARP Cl PARP actin
SI Figure S5. Western blot analysis of p53, MDM2, PUMA and p21 protein level treated with different concentration of SAR405838 (SAR) for 24 hrs in cell lines with p53 mutation or deletion. SAOS2 p53 null SW620 p53 mutation PC-3 p53 null K562 p53 null H1299 p53 null SAR (µM) 0 0.3 1 3 10 0 0.3 1 3 10 0 0.3 1 3 10 0 0.3 1 3 10 0 0.3 1 3 10 p53 MDM2 PUMA p21 actin
SI Figure S6. Stable knock-down of p53 by shRNAi in SJSA-1 cell line effectively attenuates cell growth inhibition and cell cycle arrest.
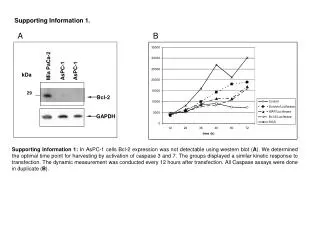
SI Figure S7. Stable knock-down of p53 by shRNAi in RS4;11 cell line effectively attenuates cell growth inhibition and apoptosis induction by SAR405838. RS4;11 Cell Line RS4;11 shC shP53 p53 GAPDH
SI Figure S8. Stable knock-down of p53 by shRNAi in LNCaP cell line effectively attenuates cell growth inhibition and cell cycle arrest by SAR405838. LNCaP Cell Line shControl shP53 SAR (µM) UT 1 3 UT 1 3 p53 MDM2 p21 GAPDH
SI Figure S9. Western blot analysis of p53, MDM2, p21, PUMA, PARP and caspase-3 in SJSA-1 tumors treated with a single, oral dose of SAR405838 at 100 mg/kg. Pharmacodynamic analysis of SJSA-1 tumors VEH SAR (100 mg/kg, po) VEH Treated time (h) 6 6 3 3 6 6 24 24 6 53kd p53 90kd MDM2 21kd p21 23kd PUMA 116kd FL-PARP cl-PARP 86kd 35kd Pro-C3 cl-C3 19/17kd 40kd GAPDH Mouse #. 1 2 25 26 27 28 29 30 2
SI Figure S10. (a). qRT-PCR Analysis of mRNA expression of MDM2, p21 and PUMA in HCT-116 tumors treated with SAR405838. (b). Analysis of protein levels of p53, MDM2, p21, cleaved PARP and caspase-3 in HCT-116 tumors treated with SAR405838 using a Mesoscaleassay. (a) (b)
SI Figure S11. (a). qRT-PCR Analysis of mRNA expression of MDM2, p21 and PUMA in RS4;11 tumors treated with SAR405838. (b). Analysis of protein levels of p53, MDM2, p21, cleaved PARP and caspase-3 in RS4;11 tumors treated with SAR405838 using a Mesoscaleassay. (a) (b)
SI Figure S12. (a). qRT-PCR Analysis of mRNA expression of MDM2, p21 and PUMA in LNCaP tumors treated with a single dose of SAR405838. (b). Analysis of protein levels of p53, MDM2, p21, cleaved PARP and caspase-3 in LNCaPtumors treated with a single dose of SAR405838 using a Mesoscaleassay. (a) (b)
SI Figure S13 Mouse weights in efficacy experiments in SJSA-1, HCT-116, RS4;11 and LNCaP xenograft models.