Issue 4b Compliance location at Contra Costa Canal at Pumping Plant #1 - Proposed Solution -
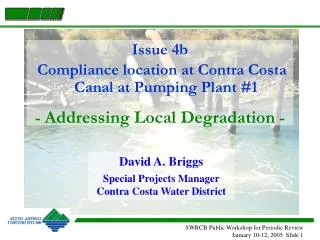
Issue 4b Compliance location at Contra Costa Canal at Pumping Plant #1 - Proposed Solution -. Richard A. Denton Water Resources Manager Contra Costa Water District. Location of Sources of Degradation. Holland Tract EC meter. Local Seepage Source. Contra Costa Canal. Pumping Plant #1.

Issue 4b Compliance location at Contra Costa Canal at Pumping Plant #1 - Proposed Solution -
E N D
Presentation Transcript
Issue 4b Compliance location at Contra Costa Canal at Pumping Plant #1 -Proposed Solution - Richard A. Denton Water Resources Manager Contra Costa Water District
Location of Sources of Degradation Holland Tract EC meter Local Seepage Source Contra Costa Canal Pumping Plant #1 Local Drainage Source
CCWD Reduced Pumping Helped with 250 Compliance in Nov. 1999 Pumping Plant #1 Holland Tract Chlorides (mg/L)
Reduced CCWD Pumping Helped with 150 Compliance in Dec. 2004 Holland Tract Chlorides (mg/L) 150 mg/L Pumping Plant #1
Historical data show degradation due to seepage and local drainage Pumping Plant #1 Chlorides (mg/L) All Data 1983-2003 All Pumping Rates
Pumping 30 cfs eliminates most effects 250 mg/L Pumping Plant #1 Chlorides (mg/L) 150 Pumping > 30 cfs
Use cutoff between 30 cfs and 60 cfs 250 mg/L Pumping Plant #1 Chlorides (mg/L) 150 Pumping > 60 cfs
Use Holland Tract to Determine Control Compliance: Beyond SWP and CVP Control Out of Compliance 250 Compliance: Pumping Plant #1 chlorides less than 250 mg/L 0.94 EC
Location of Sources of Degradation Holland Tract EC meter Local Seepage Source Contra Costa Canal Pumping Plant #1 Local Drainage Source
Proposed Modification: 250 M&I Objective • If CCWD diverting more than 20 cubic feet per second (cfs) at Pumping Plant #1 (3-day running average) and 250 mg/L chloride objective not met, M&I chloride objective considered exceeded • If CCWD diverting less than 20 cfs at Pumping Plant #1 (3-day average) and250 mg/L chloride not met, then: • Check Holland electrical conductivity (EC) from 3 days previously • If Holland EC greater than 0.94 mS/cm, M&I objective considered exceeded • If Holland EC equal to or less than 0.94 mS/cm, situation beyond control of DWR and USBR, and M&I objective not exceeded
Proposed Modification: 150 M&I Objective • Similarly, if CCWD diverting more than 20 cfs at PP#1 (3-day average) and daily chloride at PP#1 is above150 mg/L, day does not count toward 150 mg/L objective • If CCWD diverting less than 20 cfs at PP#1 (3-day average) and chlorides above150 mg/L chloride, then: • Check Holland electrical conductivity (EC) from 3 days previously • If Holland EC greater than 0.56 mS/cm, that day does not count toward 150 mg/L M&I objective • If Holland EC is equal to or less than 0.56 mS/cm, situation is beyond control of DWR and USBR, and day counts toward meeting 150 mg/L objective
Summary of CCWD Comments • Compliance location must remain at Pumping Plant #1 to ensure water diverted by CCWD is at or better than 150 mg/L and 250 mg/L M&I chloride objectives • Two major projects are currently well underway to eliminate effect of the two primary sources of degradation in Rock Slough and unlined section of Contra Costa Canal • If Pumping Plant #1 diversions less than 30-60 cfs (3-day average), M&I chloride objectives should not be considered exceeded at Pumping Plant #1 provided electrical conductivity at Holland Tract is at or better than specific EC targets • 250 mg/L = 0.94 EC • 150 mg/L = 0.56 EC
Even with Los Vaqueros, CCWD still uses Rock Slough for water quality and water supply