Download
1 / 54
600 likes | 855 Views
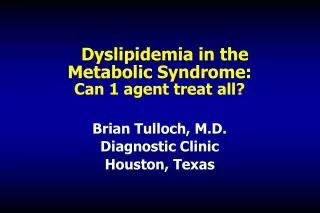
Dyslipidemia in the Metabolic Syndrome: Can 1 agent treat all?. Brian Tulloch, M.D. Diagnostic Clinic Houston, Texas. The Metabolic Syndrome in Middle-Aged Men in Finland. CHD Mortality. CVD Mortality. All-Cause Mortality. 20 15 10 5 0. 20 15 10 5 0. 20 15 10 5 0.

E N D
Dyslipidemia in the Metabolic Syndrome:Can 1 agent treat all? Brian Tulloch, M.D. Diagnostic Clinic Houston, Texas
The Metabolic Syndrome in Middle-Aged Men in Finland CHD Mortality CVD Mortality All-Cause Mortality 20 15 10 5 0 20 15 10 5 0 20 15 10 5 0 RR (95% CI) 3.55 (1.96–6.43) RR (95% CI) 3.77 (1.74–8.17) RR (95% CI) 2.43 (1.64–3.61) Metabolic Syndrome Yes No Cumulative hazard (%) 0 2 4 6 8 10 12 0 2 4 6 8 10 12 0 2 4 6 8 10 12 Follow-up (yr) Number at risk for metabolic syndrome Yes 866 852 834 292 866 852 834 292 866 852 834 292 No 288 279 234 100 288 279 234 100 288 279 234 100 Lakka et al. JAMA. 2002;288:2709-2716.
Metabolic Syndrome - AKA … • Syndrome X • Dysmetabolic syndrome • Insulin resistance syndrome • Polymetabolic syndrome • Central obesity syndrome • Deadly quartet • Coronary risk syndrome • Visceral adiposity syndrome • Atherogenic lipoprotein phenotype
“Ticking Clock” Hypothesis For Microvascular complications Macrovascular complications The “clock starts ticking” At onset of hyperglycemia Before the diagnosis of hyperglycemia WHO. Diabetologia. 1985;28:615-640. Haffner SM et al. JAMA. 1990;263:2893-2898.
Conditions Associated with the Metabolic Syndrome-Measurable indices • Central obesity (increased waist circumference) • Atherogenic dyslipidemia • High triglycerides • Low HDL, increased small dense LDL • Increased ApoB • Increased blood pressure
Conditions Associated with the Metabolic Syndrome-2 • Insulin resistance • Hyperinsulinemia • Glucose intolerance • Increased uric acid • Prothrombotic state • Increased plasminogen activator inhibitor (PAI-1) • Increased blood viscosity • Increased plasma fibrinogen • Proinflammatory state (increased C-reactive protein)
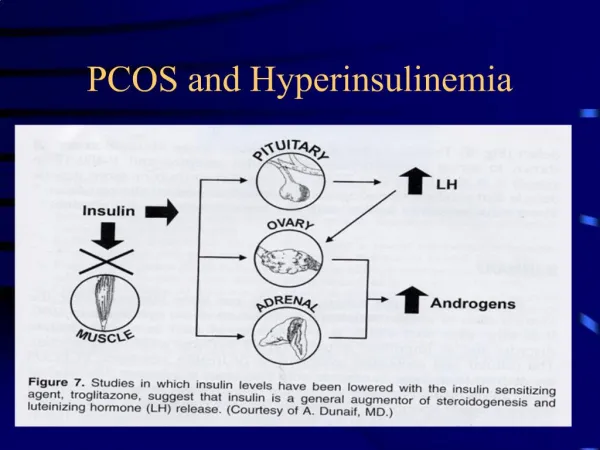
Who Has the Metabolic Syndrome? • In 2000: over 47 million Americans • Prevalence increases with age & Wt. • Age-adjusted prevalence = 23.7%. • More common in Mex-Americans. • Major risk factor for- • DM, CHD & Stroke. • PCOS. • NASH.
Diagnosis of Metabolic Syndrome-NCEP • Any three or more of 5 components: • abdominal adiposity (>40in for men,>35ins for women)103,88cms • TG >150 mg/dL • HDL-C <40 mg/dL (men), <50 mg/dL (women) • impaired fasting glucose (110–125 mg/dL) • BP >130/85 mm Hg
Pathogenesis of the Metabolic Syndrome Abdominal Adiposity Liver Enlarging adipocytes Increased glucose Increased adipocytokines and FFA Insulin resistance Inflammatory(IL-6, coagulation factors) Metabolic Syndrome
When Should Physicians Intervene? Prevention ofweight gain Weight gain Overweight and obesity Insulin resistance Metabolic syndrome Impaired glucose tolerance Diabetes Hypertension Hyperlipidemia CVD Size of populationneeding treatment
NCDP-ATP III Guidelines: Clinical Management of the Metabolic Syndrome • Management of underlying cause • Weight control (enhances LDL lowering and reduces all risk factors) • Physical activity (reduces VLDL, increases HDL and may lower LDL) • Management of lipid and nonlipid risk factors • Treat hypertension • Use of aspirin in CHD patients • Treat elevated triglycerides, lower LDL –(Raise HDL)
New Treatment Paradigm Weight Management of weightfirst, followed by anintegrated treatmentapproach Dyslipidemia Hypertension IGT
New Agents for Wt loss • 1-Endocannabinoid Blockers: Rimonabant. • 2- Incretins: Byetta.
Rimonabant in Prediabetes-Analysis from RIO-Lipids, RIO-Europe and RIO-North AmericaStudy Design • Goal • To assess the efficacy of rimonabant, a selective cannabinoid receptor blocker, against placebo in prediabetes (IFG) • Methods • Patients randomized to a daily dose of rimonabant 5mg (n=492), rimonabant 20mg (n= 508) or plcbo (n= 290) • Results from three trials were pooled at one year. Rosenstock, J. Late Breaking Clinical Trial. EASD Annual Meeting, September 2005.
Rimonabant in Prediabetes-Analysis from RIO-Lipids, RIO-Europe and RIO-North America Results Rosenstock, J. Late Breaking Clinical Trial. EASD Annual Meeting, September 2005.
Incretin Hormones Improve Acute and Chronic Aspects of Pancreatic Islet Function β β β β β • Glucose-dependent Acute Effects • Glucagon secretion (α-cell) • GLP-1 only • Insulin secretion (β-cell) • Chronic Effects • Rejuvenation of pancreas • -cell proliferation • -cell death GLP-1 and GIP are secreted in response to food intake Foodintake α-Cell β-Cell GLP-1 β Islet GIP Gault, et al, Neuropeptide , GIP: Anti-diabetic and Anti-obesity Potential? 2003 (37), 253-63.
Exenatide vs. Glargine in Treated Type 2 DiabetesResults * No difference§P <0.0001 Heine RJ. Oral Presentation. EASD Annual Meeting, September 2005
NCDP-ATP III Guidelines: Clinical Management of the Metabolic Syndrome • Management of underlying cause • Weight control enhances LDL lowering and reduces all risk factors • Physical activity reduces VLDL, increases HDL and may lower LDL • Management of lipid risk factors: • Treat elevated TG and lower LDL, raise HDL • ? C-RP. • Treat H/T- ACE/ARB, Beta blockers. • Aspirin
Treating the Lipid Triad in the Metabolic Syndrome • Available drugs: 1-Statins -New data,(HPStudy) -New statin-more potent 2-Fibric acids 3-Nicotinic acids Combinations: (watch for myalgias)
Heart Protection StudyStatin Benefit Independent of LDL-C Level Risk ratio and 95% CI Vascular Event Baseline LDL (mg/dl) Statin n=10,269 Placebo n=10,267 Statin better Statin worse <100 282 (16.4%) 358 (21.0%) 100–130 668 (18.9%) 871 (24.7) ≥130 1083 (21.6%) 1356 (26.9%) 24% SE 3 reduction(2P<0.00001) 2033(19.8%) 2585(25.2%) All patients 0.4 0.6 0.8 1.0 1.2 1.4 MRC/BHF Heart Protection Study. HPS info:slideshow presentation. Available at: http://www.lipidsonline.org.
STELLAR: LDL-C Percentage Change from Baseline at Week 6 Dose (mg) 10 20 40 80 Log scale 0 -10 -20 Pravastatin -30 LS mean % change from baseline -40 Simvastatin -50 Atorvastatin Rosuvastatin -60 Jones PH et al. Am J Cardiol 2003;92:152–160.
STELLAR: Percentage of Patients Achieving NCEP ATP-III LDL-C Goals at Week 6 100 89 89 85 80 # 82 82 82 75 #‡ *# 69 67 60 *# ‡ 63 * 55 Patients achieving LDL-C goal (%) *# 51 40 44 * 31 20 n=156 n=159 n=157 n=158 n=154 n=156 n=165 n=165 n=162 n=163 n=159 n=164 n=160 n=158 Dose (mg) 0 10 20 40 10 20 40 80 10 20 40 80 10 20 40 rosuvastatin atorvastatin simvastatin pravastatin * p<0.001 vs rosuvastatin 10mg #p<0.001 vs rosuvastatin 20mg ‡p<0.001 vs rosuvastatin 40mg
STELLAR: HDL-C Percentage Change from Baseline at Week 6 12 10 Rosuvastatin 8 Simvastatin LS mean % change from baseline 6 4 Pravastatin 2 Atorvastatin 0 10 20 40 80 Log scale Dose (mg) Jones PH et al. Am J Cardiol 2003;92:152–160.
Percentage Change From Baseline in Triglycerides at Week 6 by Dose (ITT) 10 20 40 10 20 40 80 10 20 40 0 10 20 40 80 -5 -10 -11.9 -14.8 -15 -17.6 -18.2 -19.8 * -20 -20 -22.6 -23.7 ** -25 -26.1 † -26.8 -28.2 -30 Rosuvastatin (mg) Atorvastatin (mg) Simvastatin (mg) Pravastatin (mg) -7.7 -8.2 Mean Percent Change From Baseline in TG Levels -13.2 *P<.002 vs pravastatin 10 mg, 20 mg **P<.002 vs simvastatin 40 mg; pravastatin 20 mg, 40 mg † P<.002 vs simvastatin 40 mg; pravastatin 40 mg Jones PH, Davidson MH, Stein EA, et al. Am J Cardiol. 2003; 93:152-160.
Sideaffects: Muscle & Liver E. Bryan Brewer, Amer Jrnal of Cardiology 92:4B23K-29K
Protein Handling by the Kidney Albumin Low molecular weight proteins Tubular proteinuria Glomerular proteinuria Normal Plasmaconcentration,mg/L 40,000 4 40,000 4 40,000 4 2 2 2 2 2000 2 Filtered load, mg/dayif GFR – 150L/day 360,000 360 360 360 360 360 50 50 95 95 95 95 % reabsorbed Daily excretion, mg 18 18 18,000 18 180 180
Inhibition of Albumin Uptake andCholesterol Synthesis 100 Rosuvastatin Simvastatin 80 Pravastatin 60 Inhibition of Albumin Uptake (%) 40 20 0 0 10 20 30 40 50 60 70 80 90 100 Inhibition of Cholesterol Synthesis (%) Preclinical data: proximal tubule-derived opossum kidney cell line. Sidaway et al. Poster presented at: 41st Congress of the European Societies of Toxicology;September 28-October 1, 2003; Florence, Italy.
Effects of Rosuvastatin on Proteinuria in Patients† With Baseline Proteinuria ≥40 mg Rosuvastatin for ≥96 Wk (n = 53) Patients (%) Change in Urine Protein—Baseline to Last Visit Data on file, (DA-CRS-07) AstraZeneca Pharmaceuticals LP, Wilmington, DE.
Changes in Plasma Creatinine in Patients TreatedWith 40 mg of Rosuvastatin for 96 Weeks: • *Last visit compared to baseline. • Data on file, (DA-CRS-07) AstraZeneca Pharmaceuticals LP, Wilmington, DE.
Fibrate Mechanisms of Action Fibrate Fibrate PPARa PPARa ↑LDL Particle Size ↓Triglycerides ↑LDL Particle Size ↓Triglycerides ↑HDL Synthesis ↓Inflammation ↑HDL Synthesis ↓Inflammation ↑Reverse Cholesterol Transport ↑Reverse Cholesterol Transport
Helsinki Heart Study: Enhanced Reduction of CHD Events in Patients With Type 2 Diabetes 12 P<.19 P<.02 10 8 5-Year Incidence of CHD, % 6 4 2 0 Type 2 (n = 135) Other (n = 3946) Type 2 on Placebo (n = 76) Type 2 on Gemfibrozil (n = 59) Mean baseline characteristics: Total-C 291 mg/dL;LDL-C 200 mg/dL; HDL-C 46 mg/dL; TG 236 mg/dL. Koskinen P, et al. Diabetes Care. 1992;15:820-825.
VA-HIT: CVD Risk Reduction in Diabetics Compared With Nondiabetics Combined End Point Nonfatal MI CHD Death Stroke 0 5 3 10 P=.88 10 15 P=.67 20 18 Cumulative Event Rate Change, % P=.07 22 21 25 P=.17 P=.09 30 32 35 P=.004 DM 40 No DM 40 41 P=.26 45 P=.046 P=.02 Rubins HB, et al. Arch Intern Med. 2002;162:2597-2604.
BIP: Enhanced Event Rate Reduction in Patients With Augmented Features of the Metabolic Syndrome* P=NS 33% Reduction P=.05 54% Reduction P=.005 *Patients with 4-5 risk factors for the metabolic syndrome Tenenbaum A, et al. Arch Intern Med. 2005;165:1154-1160.
Adjustment for Statin Use Adjusted Primary End Point in Patients With No Prior CVD Primary End Point: CHD Events Secondary End Point: Total CVD Risk P=.16 P=.01 P=.004 P=.035 P=.004 Abbreviations: Adj, adjusted for statin use; Nonadj, nonadjusted risk The FIELD Study Investigators. Lancet [Early Online Publication]. November 14, 2005.
Outcomes in Fibrate Trials:Diabetic or Metabolic Syndrome Major CVD Event Rate
Combo Therapy • HIGH LDL: Water-soluble statin • +Resin/Zetia • +Fibrate • + Niaspan • ?Vytorin?-(Zetia+Zocor) E-mycin/Grpefruit/Ca- Channel blockers-Myositis
Combo Therapy • HIGH T/G’s: • Statin(Water-sol) + Fibrate • Statin(w/s) + Fibrate + Niaspan • SUPER-HI T/G’s (>2,000- Danger of Pancreatitis): • Fish Oil + Fibrate + Niaspan • (?+ Crestor)
Metabolic Syndrome - Goals for Therapy • Control Weight +promote excercise • LDL-C <100 mg/dL, raise HDL • Triglycerides < 150 mg/dL • Control BP <130/80 • Control sugar, HbA1c <6.5 • Clotting-Aspirin (81 or 325 mg) • Microalbuminuria ACE-inhibition • Previous MI -blocker • ? Treat CRP: -Statin/Fibrate
When to Measure hs-CRP • Measure hs-CRP when it influences decision to initiate or intensify lipid-lowering treatment: • primary prevention in young individuals with strong family history • secondary prevention with LDL-C <100 mg/dL, • No need to measure in: • secondary prevention and type 2 diabetes with LDL-C >100 mg/dL or non–HDL-C >130 mg/dL
AHA/CDC Panel: Recommendations for hs-CRP Testing • Measurements of hs-CRP: perform twice (2 weeks apart) • results averaged, • fasting or nonfasting, in metabolically stable patients • if level >10 mg/L, repeat test, examine for sources of infection • Relative risk categories for hs-CRP levels: • low <1 mg/L • average 1.0–3.0 mg/L • high >3.0 mg/L Pearson TA et al. Circulation. 2003;107:499-511.
National Cholesterol Education Program (NCEP)Adult Treatment Panel III(ATP-III) Guidelines:Metabolic Syndrome is a HIGH RISK equivalent:
Conclusions • NCEP ATP III guidelines: intensity of lipid treatment depends global CHD risk. • HIGH-RISK patients are CHD/CVD equivalents, including METABOLIC SYNDROME , DM, +those with 2 RF & hi (>3 mg/L) hs-CRP. • Lipid monotherapy, esp. a statin, is effective and safe; • consider combo therapy to reach HI RISK pt goals.
New ICD Codes for Metabolic Syndrome 277.7 Dysmetabolic Syndrome X Use additional codes for associated manifestations, As follows:
HHS: Significant Reduction of CHD Events in Patients With High Triglyceride and LDL/HDL Ratio 71% Reduction P<.005 LDL/HDL ≤5 LDL/HDL >5 Triglyceride values are in mg/dL Manninen V, et al. Circulation. 1992;85:37-45.
BIP: Event Rate Reduction in Patients With the Metabolic Syndrome 23% Reduction P=.03 29% Reduction P=.02 33% Reduction P=.009 26% Reduction P=.056 *Fatal MI, Nonfatal MI, and Sudden Death Tenenbaum A, et al. Arch Intern Med. 2005;165:1154-1160.
Fenofibrate Versus Placeboin Patients With Mixed Dyslipidemia Baseline LDL-C >160 mg/dL and TG 150 mg/dL (Type IIb) Reductions in Triglycerides Increases in HDL-C Reductions in LDL-C *P<.05 *P<.05 *P<.05 +1% +15%* -7% Mean Change, % +2% -20%* -36%* TriCor (n=126) Placebo (n=116) TriCor (n=126) Placebo (n=116) TriCor (n=126) Placebo (n=116) Mean HDL-C baseline: 47 mg/dL Mean LDL-C baseline: 220 mg/dL Mean TG baseline: 232 mg/dL TriCor was assessed in multicenter clinical trials of 3 to 6 months duration in Type IIa and Type IIb patients with mean baseline LDL-C of 213.8 mg/dL The independent effect of raising HDL-C or lowering TG on the risk of cardiovascular morbidity and mortality has not been determined TriCor package insert. Abbott Laboratories. Please see accompanying full prescribing information