Download
1 / 39
390 likes | 507 Views
The TF-LUCE meeting held on September 19, 2012, addressed various issues and opportunities related to land use and circulation in San Luis Obispo. Highlights included reviews of community survey findings which indicated a high quality of life and strong commitment to environmental preservation from residents. The meeting also discussed plans for future workshops, public comments, and ongoing engagement with the community. Residents expressed concerns about traffic, housing affordability, and homelessness, while valuing the city’s natural beauty and unique character.

E N D
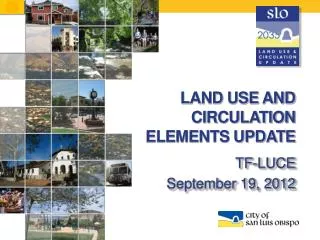
LAND USE AND CIRCULATION ELEMENTS UPDATE TF-LUCE September 19, 2012
Agenda: Issues & Opportunities • Welcome – Chair Eric Meyer • Meeting Minutes from 7-18-12 • Community Survey Findings • Background Report Summary Findings • Community Workshop planning – September 27th • Neighborhood Open Houses – September 29th • Public Comment for items not on the agenda • Confirm next TF-LUCE meetings • Adjourn
Meeting Minutes • Action Minutes: Reflect general discussionDocument actions taken • Want to hear more details?Recordings of meetings are available on project website: www.slo2035.com • Draft meeting minutes from July 18thAction = Approve as presented OR Approve as amended
Distributed to 25K+ residents and businesses in the City of San Luis Obispo via utility bill inserts and mail Based on a survey conducted by the City in 1998 Made available as an online survey Completed by 2,029 people via return mail and 169 people online Indicates a strong commitment to environmental preservation within the City Community Survey Overview
Part 1: quality of life 2012 City of San Luis Obispo Survey
Q 1: How would you rate the overall quality of life in San Luis Obispo? Eighty-one percent of respondents rated the quality of life as “high” with less than 2% rating it as low.
Q 2: What do you see as San Luis Obispo’s greatest problem? Respondents top choices were the homeless 19%, traffic 10% lack of jobs and affordable housing -both cited by 9%. Downtown parking and congestion was cited by 8%. Many expressed concerns about future growth and development. Big Box StoresBusinessCal PolyCity CouncilCollege StudentsCost of LivingDevelopmentDowntownGovernmentGrowthHomelessHousingJobsNeighborhoodsPlanningPoliceQualityRegulationShoppingStreetsTrafficWater
Q 3: What do you see as San Luis Obispo’s greatest strength? Respondents overwhelmingly referred to the City’s weather, location and unique character. Quality of life was equated with the natural environment and overall pace of life. BeautyCal PolyDowntownFriendly PeopleLocationLow CrimeNatural EnvironmentOpen SpaceQuality of LifeSizeWeather Slow Growth
Q 4: Listed below are several aspects of "quality of life" in San Luis Obispo. On a scale of 1 to 5, with 1 being LEAST important and 5 being MOST important, respondents rated natural environment and crime highest priorities.
Q 5: Respondents were asked to indicate how satisfied they are with current conditions on a scale of 1 to 5 with 1 being VERY DISSATISFIED and 5 being very SATISFIED. Overall satisfaction was high in most categories.
Q 6: One part of the City respondents particularly enjoy? Downtown was the highest choice with 37%, followed by the City’s parks 11% and the Mission 9%. BikeBishop PeakCal PolyCenterCreekDowntownFarmer's MarketHiguera Hiking TrailsIrish Hills Laguna LakeMadonna MissionMountainNeighborhood Old TownOpen SpaceParkRailroad ShoppingSinsheimerStreetWalking
Q 7: One part of the City respondents particularly do not like? The vast majority of “dislikes” were directed at traffic – specifically on Los Osos Valley Road and South Higuera – homeless issues and congestion downtown. BroadCal PolyCostcoDowntownFoothillHomelessLOVRMadonnaLos Osos Valley RoadParkingPrado RdSouth HigueraStreetTank Farm
Part 2: city growth and relationship to region 2012 City of San Luis Obispo Survey
Q 8: Which of the following approaches to determining allowable growth in the City do you support? Respondents continue to support preservation of the natural environment. Sixty–six percent want to keep growth in existing areas and 60% support avoiding harm to natural environment.
Q 9: If the city was to change the current residential growth rate of 1%, which one of the following would you prefer? Nearly 55% of respondents support “No Change” with over 14% supporting some increases but none greater that the County or the State as a whole. Just 10% supported no growth limits.
Q 10: San Luis Obispo has worked to balance development and conservation to preserve the City’s natural beauty, unique character and heritage while supporting housing opportunities and a vibrant economy. Respondents were asked it the City has not enough, enough or too much of the following types of development: Respondents indicated the City has “enough” of each category however housing and manufacturing were cited as low by some.
Q 11: On a scale of 1 to 5, with 1 being no impact and 5 being substantial impact, how much do the following factors influence the character and quality of life in San Luis Obispo? Air quality, development on farmland or creeks, form of development and overall intensity of development were cited as the factors that MOST influence quality of life in San Luis Obispo.
Q 12: San Luis Obispo and the surrounding area include about 34% of the jobs in the county, and about 18% of the houses and apartments which results in commuting. On a scale of 1 to 5 with 1 being no effort and 5 being high effort, how much effort do you think should go into each of the following approaches to reduce commuting impacts? Respondents indicated they would like the City to focus the most effort in discouraging commuting by individual drivers and the least effort in discouraging additional jobs here in San Luis Obispo. More local employment translated to fewer commuters.
Part 3: Form of development 2012 City of San Luis Obispo Survey
Q 13: To accommodate new housing in the City I support: Seventy-one percent of respondents supported using vacant lots in existing neighborhoods for buildings like those which have been built in the neighborhood with over 63% supporting redeveloping underdeveloped sites with buildings compatible with the neighborhood. A little more than half supported mixed use infill development in existing buildings.
Q 14: To accommodate new stores, banks, business park development and offices, I support: (Check all that apply.) The clear preference with 80% of respondents choosing it was development in existing commercial areas, using vacant lots for new buildings generally like ones which have been built there.
Q 15: On a scale of 1-5, with 1 being LESS and 5 being MORE, indicate below whether you would like to have less or more of the following types of land uses in certain areas, compared with current conditions. Only two land uses resulted in substantial differences, with 59% seeking fewer bars downtown and 71% seeking small city parks in residential areas.
Part 4: public facilities and services 2012 City of San Luis Obispo Survey
Q: 16. On a scale of 1 to 5 with 1 being less and 5 being more, do you think the city should provide less or more of each of the following services? Four areas were supported by the majority of respondents; 50% would like more bicycle lanes, 58% support acquiring open space peaks and hillsides, 53% support more land for creeks and marshes while 54% support more land for City’s Greenbelt.
Q 17: If you think the city should provide more of a certain service, indicate whether you would be willing to pay more for it. Despite support for some services, a slight majority of respondents said they would support paying more for just two; 54% for open space for peaks and hillsides, and 52% for acquiring space for the City’s greenbelt.
Q 18: The public or private facility or service not available here which I would most like to be provided is: The majority of comments related to public transportation (bus service) and private transportation (taxi services, airline services and reliable rail). Better services to assist and manage the homeless was also identified as a priority. BikeBusCal PolyCenterCommunityDepartmentDowntownFlightsHealth CareHomelessHousingJobsLibraryLight RailMedicalMoneyOpen SpaceParkingPool PublicServiceShoppingSLOStreet
Part 5: Demographic information 2012 City of San Luis Obispo Survey
Q 19: Please check all that apply. Ninety-four percent of respondents live in the City of San Luis Obispo. Forty-five percent work in the City while 23% own a business.
Q 20: Do you own or rent your dwelling? Seventy-three percent of respondents own their dwelling with 27% renting.
Q 21: Which best describes your status? Fifty-four percent of respondents said they were employed, 36% retired, 6% listed “other,” 4% were students and less than one percent listed unemployed.
Background Report – How is it used? • Understand where the City is today • Will include the regulatory setting – Federal, State and local regulations/policies • Used as environmental “baseline” of existing conditions to evaluate any changes that are proposed San Luis Obispo Development 1876 San Luis Obispo Development 2010
Background Report – Summary Findings • Preliminary Draft • Full Report will be available in November – information is still being gatheredTonight is a sneak peek! • One correction noted to date (page 4 of attachment labeled “Summary of Major Findings”): A total of 4,081 acres of open space active recreational areas, and other natural areas are in the San Luis Obispo Planning Area.
Workshop Planning – Table Info • Boards at each table – • Facts about topic • Photos or Graphics • Questions to help start discussions
Workshop Planning – September 27th • Volunteers for each of the 6 tables and one “Other Thoughts” area: Transportation – motorized Transportation - non-motorized Downtown New Growth Areas Creative Reuse of Land Community Facilities/Amenities Other Thoughts • Questions to help start discussions – staff will work with task force members from each table over the next few days to help finalize questions
September 29th Open Houses 9:30 –11:30 am New Frontiers 12:30 – 2:30 pm Zion Lutheran Church 3:00-5:00 pm Senior Center Identify Task Force members who will participateSimilar format to open houses held in July
Other Opportunities • Planning Commission - Status Update of LUCE process on September 26th • City Council – Status Update of LUCE process on October 16thThe Council has indicated they would like to hear from Task Force members if any are inclined to provide comments at either (or both!) the Commission or Council meetings
Public Comments and Next Meetings • 1. Public comments for items not on the agenda • 2. Next Task Force meetings will be: • September 27th Workshop September 29th Open Houses – 3 locations • October 17th – TF LUCE Meeting6 pm Library Community Room