Download
1 / 22
220 likes | 339 Views
This study investigates whether shelf placement in grocery stores affects the nutritional values of cereals, specifically calories, fat, fiber, and sugar content. Data was collected from four shelves in an ACME store, with cereals randomly selected for analysis. The hypothesis testing utilized Analysis of Variance (ANOVA) to assess differences in mean nutritional values across shelf placements. Notably, significant differences were found in fiber and sugar content between the shelves, prompting further exploration of cereal marketing and placement strategies.

E N D
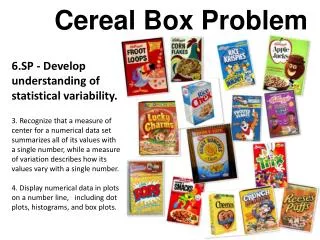
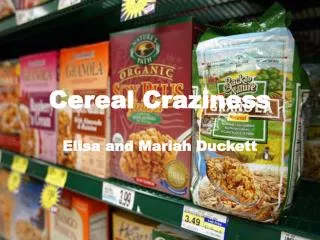
Cereal Craziness Elisa and Mariah Duckett
What we wanted to know We wanted to know if there were any variables that affect the shelf placement for cereal.
What We Did… • we went to ACME • used a random number generator to randomly select a starting cereal on every shelf and then recorded data for every other cereal on that shelf • there were 4 shelves, 1 being the top, 4 being the bottom
Our variables Calories Fat Fiber Sugar
Calories per cup • HO: There is no difference between shelf placement and the mean calories per cup. (Ho: μ1 = μ2 = μ3 = μ4.) • HA: There is at least one difference between shelf placement and the mean calories per cup.
Conditions/Assumptions • Random: While the store was not randomly chosen, we can assume the cereals in ACME are representative of all major grocery stores. The cereals were randomly selected using systematic sampling. • 10% Condition:The sample size of 11 is small enough to be compared to all cereals. • Similar Variance Condition: The boxplots show similar spread. There is an outlier however on shelf one (ACME Crunchy Wheat & Barley). • Nearly Normal Condition: We assume the residuals are nearly normal
Analysis of Variance test • With a p-value of .07, we fail to reject the null hypothesis. There is little evidence that there is a difference in the mean Calories per cup between shelves.
Fat (in grams) per cup • HO: There is no difference between shelf placement and the mean fat per cup. (HO: μ1 = μ2 = μ3 = μ4.) • HA: There is at least one difference between shelf placement and the fat per cup.
Conditions/Assumptions • Random: While the store was not randomly chosen, we can assume the cereals in ACME are representative of all major grocery stores. The cereals were randomly selected using systematic sampling. • 10% Condition:The sample size of 11 is small enough to be compared to all cereals. • Similar Variance Condition: The boxplots show similar spread, however there are 2 outliers. One outlier is on shelf 3; the other outlier is on shelf 4 and is Reese’s Puffs. We will run the test with and without the outliers. • Nearly Normal Condition: We assume the residuals are nearly normal.
Analysis of Variance • With a p-value as high as .87, we fail to reject the null hypothesis. There is little evidence that there is a difference of the mean fat per cup of cereals on each shelf.
Analysis of Variance again • We will now run an Analysis of Variance test without the two outliers: • While the elimination of the outliers did make a difference, the p value is still too high at .56 to reject the null hypothesis. • There is little evidence that there is a difference of the mean fat per cup of cereals on each shelf.
Fiber (in grams) per cup • HO: There is no difference between shelf placement and the mean fiber per cup. (HO: μ1 = μ2 = μ3 = μ4.) • HA: There is at least one difference between shelf placement and the mean fiber per cup.
Conditions/Assumptions • Random: While the store was not randomly chosen, we can assume the cereals in ACME are representative of all major grocery stores. The cereals were randomly selected using systematic sampling. • 10% Condition:The sample size of 11 is small enough to be compared to all cereals. • Similar Variance Condition: The boxplots shows that there is not equal variance within the data. After the lack of help re-expressing the data provided, we will proceed with caution. • Nearly Normal Condition: We assume the residuals are nearly normal.
With a p-value as low as .0065, we reject the null hypothesis. There is strong evidence that there is at least one difference in the means of fiber per cup of cereal and shelf placement. In comparing the means of each shelf, shelf one had a higher content in fiber. Shelf one had a mean fiber content of 6.71 grams, while shelves two, three, and four had means of 4.27 grams, 2.24 grams, and 1.5 grams, respectively.
Sugar (in grams) per cup • HO: There is no difference between shelf placement and the mean sugar per cup. (HO: μ1 = μ2 = μ3 = μ4.) • HA: There is at least one difference between shelf placement and the mean sugar per cup.
Conditions/Assumptions • Random: While the store was not randomly chosen, we can assume the cereals in ACME are representative of all major grocery stores. The cereals were randomly selected using systematic sampling • 10% Condition:The sample size of 11 is small enough to be compared to all cereals. • Similar Variance Condition: The boxplots show similar spread. • Nearly Normal Condition: We assume the residuals are nearly normal.
With a p-value as low as .013, we reject the null hypothesis. There is strong evidence that there is at least one difference in the means of sugar per cup of cereal and shelf placement. In comparing the means of each shelf, shelf four had a higher content in sugar. Shelf four had a mean sugar content of 15.17 grams, while shelves one, two, and three had means of 10.47 grams, 8.16 grams, and 11.77 grams, respectively.
Our conclusion • After running our four different ANOVA tests, we determined that calories and fat in cereal have little to do with shelf placement. • Both fiber and sugar content however seem to affect shelf placement of cereals. • Reasons for this can include market appeal. Shelf four overall had a higher average in sugar content.
Conclusion continued… • This could be because cereals with higher sugar content usually appeal to children and shelf four is closest to their level. • Shelf one had an overall higher average in fiber content. This could be because most cereals on Shelf one are the health cereals (which usually means high in fiber) that usually appeal to adults, who are the only ones tall enough to reach the top shelf.