Download
1 / 34
340 likes | 538 Views
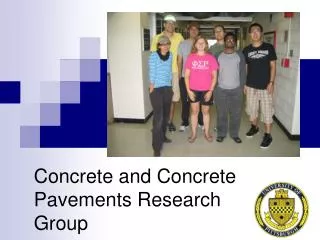
Concrete Overlay Research. SCI. Gears. Performance. Measured Responses. Layer Interactions. Shelley Stoffels, D.E., P.E. Lin Yeh, PhD. FAA Airport Pavement Working Group Meeting, April 2012. Baseline Experiment—2006. 9 inch OL. 7.5 inch OL. 6 inch OL. 10 inch SL. 7.5 inch UL.

E N D
Concrete Overlay Research SCI Gears Performance Measured Responses Layer Interactions Shelley Stoffels, D.E., P.E. Lin Yeh, PhD FAA Airport Pavement Working Group Meeting, April 2012
Baseline Experiment—2006 9 inch OL 7.5 inch OL 6 inch OL 10 inch SL 7.5 inch UL 6 inch UL Low-strength Subgrade Medium-strength Subgrade High-strength Subgrade SCI Validation Study—2007/2008 7.5 inch OL 6 inch OL 10 inch SL 7.5 inch SL 9 inch OL 6 inch SL Low-strength Subgrade Medium-strength Subgrade High-strength Subgrade CC4 conducted through IPRF consisted of two overlapping experiments (QES)
NORTH SOUTH 10 12.5 12.5 12.5 12.5 5 5 12.5 12.5 12.5 12.5 6-inch P-154 Aggregate Base Experimental design included thickness variations, matched and mismatched joints
10.25 in. North test items were loaded with triple dual tandem and South test items with dual tandem
8.6-in PCC OL SCI Passes Date 08/01/06 2046 80 6 12 Final Passes OL SCI UL SCI 08/03/06 2574 73 08/04/06 2574 73 6.3-in PCC UL 5146 14 32 5 11 5.6-in Aggregate Base 08/10/06 2772 68 Subgrade k=135 pci 08/11/06 3234 63 10 4 08/24/06 3234 57 08/28/06 3234 46 10 Triple Dual Tandem 10 10 8 8 09/13/06 3234 39 6 6 54 in 4 4 09/14/06 3744 31 9 3 09/19/06 4552 24 09/22/06 5146 19 57 in 09/29/06 5146 16 2 8 57 in 10/02/06 5146 14 10/03/06 5146 12 50,000 lbs/wheel 230 psi tire pressure 1 7 -30 -17.5 -5 0 -25 -12.5 Test Item N1 UL SCI = 100
8.7-in PCC OL 08/04/06 3168 93 6 12 08/08/06 3432 85 Final Passes OL SCI UL SCI SCI Passes Date 08/09/06 3894 78 6.3-in PCC UL 08/10/06 4356 76 08/11/06 4818 67 12142 7 39 5 11 5.8-in Aggregate Base 09/13/06 5016 54 09/14/06 5526 51 Subgrade k=135 pci 09/19/06 8116 50 09/22/06 8116 46 4 10 09/26/06 9370 32 10 Dual Tandem 10 10 8 8 09/29/06 11020 22 6 6 54 in 4 4 10/02/06 11614 16 3 9 10/03/06 12142 7 57 in 10/31/06 12142 7 2 8 50,000 lbs/wheel 230 psi tire pressure 1 7 30 5 17.5 0 12.5 25 Test Item S1 UL SCI = 100
Transition 1S-12U 1N-12U 1N-6U 1S-6U 02/20/07 1S-11U 1N-5U 1N-11U 1S-5U 1N-10U 1N-4U 1S-10U 1S-4U 1S-9U 1N-3U 1N-9U 1S-3U 1N-2U 1S-8U 1N-8U 1S-2U 1N-7U 1N-1U 1S-7U 1S-1U Transition 12/18/06 Structural Section 1
9.3-in PCC OL 12 6 4950 77 11/21/07 SCI Passes 3696 88 Date 11/14/07 7194 68 12/03/07 6.3-in PCC UL 4422 83 11/19/07 7986 55 12/05/07 5 11 5.6-in Aggregate Base 8712 51 12/07/07 9108 48 12/10/07 Subgrade k=135 pci 9504 42 12/11/07 4 10 11286 27 12/19/07 10 Triple Dual Tandem 10 10 8 8 13398 26 01/11/08 6 6 54 in 4 4 14850 24 01/16/08 9 3 15510 12 01/18/08 57 in 8 2 57 in 42.5k lbs/wheel 230 psi tire pressure 1 7 -30 -17.5 -5 0 -25 -12.5 Test Item N1 Underlay SCI Beginning 25 Final 3
9.3-in PCC OL 12 6 SCI Passes 33264 20328 27126 31350 32604 30756 24684 18 20 23 29 58 52 46 Date 03/26/08 03/11/08 03/21/08 03/05/08 04/02/08 03/24/08 02/25/08 6.3-in PCC UL 5 11 5.8-in Aggregate Base Subgrade k=135 pci 9966 88 12/13/07 10 4 10 Dual Tandem 10 10 8 8 6 6 54 in 4 4 30096 31 03/20/08 14850 80 01/16/08 3 9 16316 80 01/23/08 57 in 19008 70 02/01/08 2 8 19602 63 02/04/08 42.5k lbs/wheel 230 psi tire pressure 1 7 30 5 17.5 0 12.5 25 Test Item S1 Underlay SCI Beginning 23 Final 8
Final Loading Status 50,000-lb wheel load 42,500-lb wheel load
Preliminary Findings from CC4Observations from Distress Surveys • For unbonded overlay over intact slabs, the initial cracks were longitudinal, and longitudinal cracking, both top-down and bottom-up, predominated throughout testing. • For unbonded overlay over damaged slabs, the initial cracks were longitudinal, but a variety of cracking progressed. Greatest distress concentrations in overlay over greatest distress in underlying.
Preliminary Findings from CC4Observations from HWD • Continued deterioration of the underlay slabs, in place throughout both experiments, could be seen in the progressive decrease of backcalculated moduli. • After placement of the new overlay, the backcalculated stiffness for the upper layer was fully recovered. However, some of the underlying layers also exhibited an apparent (temporary) stiffened effect. • The load transfer efficiency at mismatched joints deteriorated less than at matched joints in the same test item.
Preliminary Findings from CC4Observations from Instrumentation • The soil pressure cells during loading of the second overlay experienced significantly greater (normalized) responses than those in the initial testing. • The ratio in magnitude of peak strain produced by the triple dual tandem and twin dual tandem gears is not inversely proportional to the number of passes to failure. The ratio of passes to achieve a given SCI is greater than can be explained only by the peak magnitude of the measured strains. • For all ratios of overlay to underlay thickness, the peak strains from instrumentation were larger in the overlay than in the underlay. This corresponds to the observed relative distress progression.
Preliminary Findings from CC4Comparisons to Design Models • The test items loaded with the twin dual tandem consistently required more passes to achieve a given SCI level than the test items loaded with the triple dual tandem at the same wheel load. This reinforces that gross aircraft weight is an important factor. • The thin overlay over thick overlay cross section performed better than anticipated. While the overlay deteriorated at a rate similar to that of the other test items, the underlay slabs had only minor distress at the end of the testing. • The unbonded overlay data, consolidated from both experiments, did not follow the pattern of slowing deterioration shown by the Rollings relationship between Cn and SCI, instead following an almost linear trend. A likely explanation is the corresponding deterioration of the underlying slabs, resulting in decreasing support with increased cumulative passes.
Preliminary Findings from CC4Relative Comparison to FAARFIELD • The thick-over-thin test items did not perform as well as predicted. • The effects of underlying cracking, in terms of reducing relative passes to an SCI of 80, were not as significant as expected. • The relative differences in passes to an SCI of 80 for the twin dual tandem as compared to the triple dual tandem were greater. • Stress estimations from FAARFIELD, in terms of relative values, corresponded to the relative degree of damage to the underlay versus overlay that was observed in the Baseline Experiment.
FAARField Damaged slab material characterization for stress computation Failure model for traffic prediction for concrete overlays
Based on data of six individual slab-on-subgrade structures (WES) Assumed 50% of a test item would have that distress to compute SCI FAARFIELD Cracked Slab Model (Rollings)E-Ratio = 0.02 + 0.0064 X SCI + (0.00584 X SCI)2E-Ratio: Damaged Modulus / Intact ModulusSCI: A rating based upon the observed structural distress (ASTM D5320) A. Structure and Materials Relationship between pavement condition and materials characterization
Model Assessment Backcalculation (BAKFAA) As-built thickness from level surveys supplemented with core data Seed modulus = design modulus Average modulus of 12 slabs = modulus of a test item
Relationship between SCI and elastic modulus based upon backcalculation results and distress surveys. • Should relationships from backcalculations with elastic layer analysis be valid for use in finite element forward calculations? • Rollings used only the maximum deflection due to the crack discontinuities. • It is suggested that additional sensors be used for unbonded overlays. Relationship was developed for single slab, assuming half would be deteriorated. Field SCIs based upon sample units. • Is SCI the only parameter having a significant effect on variation of elastic modulus? • A key area of investigation is the re-examination of the SCI and modulus relationship and the possible development of a modified cracked slab model.
The Modulus “Side of the Equation” • Backcalculation Approaches • Layered elastic • Plate theory • 3D finite element • Backcalculation Considerations • Interlayer effects • Interface conditions (bonded, unbonded) • Overlay cracking • Sources of Data • Slab test data (WES) • Full-scale rigid pavement data (CC2) • Full-scale UBOL data (CC4)
The Distress “Side of the Equation”Exploratory Statistical AnalysisPredictive Variables Selection Overlay Data Underlay Data
D. Failure Model SCI = 80 is defined as failure (i.e. 50% low severity longitudinal crack) Current failure model has been developed based on rigid pavement. Can the same failure model be applied to unbonded concrete overlay design? The damage accumulation and failure model for unbonded concrete overlays is being reassessed. Given the two concrete pavement layers and the interaction of relative deterioration, another model may be more effective than that used for original pavements.
Traffic Prediction Model DF: Ratio between flexural strength and 75% of maximum tensile stress at bottom of a free slab under edge loading
Traffic Prediction ModelDevelopment Explorations Proposed Design Factor for UBOL
Traffic Prediction ModelExplorations THANK YOU!