Download
1 / 23
230 likes | 373 Views
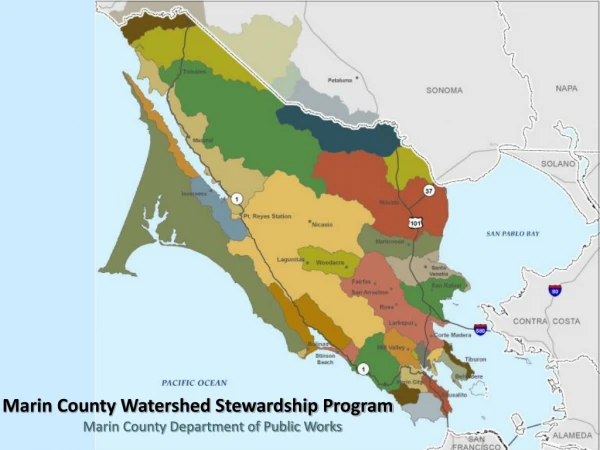
Desalination for Marin County. Paul Helliker General Manager Marin Municipal Water District North Bay Watershed Association April 5, 2007. 2-Minute History of MMWD Water. 1996 Lagunitas Creek Settlement. Annual Rainfall: 1879 through 2001. 1971 Measure B Fails. 1982 Kent Lake Raised.

E N D
Desalination for Marin County Paul Helliker General Manager Marin Municipal Water District North Bay Watershed Association April 5, 2007
2-Minute History of MMWD Water 1996 Lagunitas Creek Settlement Annual Rainfall: 1879 through 2001 1971 Measure B Fails 1982 Kent Lake Raised 1960 Nicasio 1992 Measure V Passes 1979 Soulajule 1953 Kent 1977 Richmond Bridge Pipeline 1948 Bon Tempe 1991 Measure W Fails 1918 Alpine 1990 Pilot De-Sal Plant 1976 First Russian River Imports 1912 MMWD formed
Current MMWD Supplies High cost Supply will decrease 25% Climate uncertainties
Projected Supply and Demand Acre-feet 1987 Demand 35000 Current Yield 30000 Future Yield 25000 20000 15000 10000 5000 0 2002 2005 2010 2015 2020
Projected 2020 Scenario • Current supply deficit: 3,200AF • Demand increase: 1,560AF • Projected loss of NMWD capacity: 2,300AF • Total projected deficit: 7,060 AF
MMWD Options • Conservation • Remains first choice • Already achieved 25% savings • BMPs implemented and very aggressive tiered rates • Additional reductions may cost more than other options • Recycling • Currently have many innovations in place • Expansion complicated by cost and water quality issues • Imports • Endangered species protection limitations • Least costly now – likely increase • Desalination • Reliable supply • Cost and energy use are major issues
MMWD Plan • Proximity to infrastructure • Mix brine with wastewater in existing deep water outfall • Intake water is less saline and is warmer than ocean • No power plant impacts • Public ownership • Reduce imports
MMWD Desalination Pilot Program & EIR • Nine/Twelve month demonstration and test • Conventional/MF/UF pretreatment, 4 Reverse Osmosis makes • Chemical, biological testing of water streams • Dilution modeling • Fisheries studies • Entrainment analysis
Intake Screening • Designed to meet Federal and State criteria for fish protection • 3/32-inch openings • <0.3 fps velocity • airburst cleaning • Located at end of existing 2000-ft pier • Multiple screens for full-scale facility
Reverse Osmosis (RO) Desalination • Tested four manufacturers • Three RO elements per train • Initial problems with non-standard sizes • All performed acceptably – fewer cleanings with MF/UF
Bay Fish SamplingSummary of Results • Northern anchovy & Pacific herring common in midwater trawl • Bay goby, shiner perch common in otter trawl • Dungeness crab most common invertebrate • Species composition similar to CDFG sampling • Spiny dogfish not collected by CDFG • Long-term CDFG data can be used in the environmental analysis
Pilot Plant Entrainment Study • Measurement of species composition, seasonal distribution, and densities of icthyoplankton, crab, shrimp, oysters • Twice monthly for 12 months • Use Empirical Transport Model, Adult Equivalent Loss and Fecundity Hindcast models to estimate entrainment impacts
Taxa Total Annual Entrainment Annual 2FH Estimate Annual AEL Estimate ETM: Pm Estimate Pacific Herring 229,061,594 31,396 67,458 0.000625 unidentified gobies 1,860,969 4,698 3,089 0.000298 northern anchovy 615,864 40 45 N/A yellowfin goby 565,866 200 * 0.000224 Estimated Entrainment
Results to Date • ETM estimates range from 0.02 – 0.06%, well below sustainable harvest level of 30-40% • No northern anchovies in source water – no ETM estimate • No salmon, steelhead or sturgeon larvae were collected
Brine Discharge Analysis • Analyzed near- and far-field dilution of brine in sewage effluent • Brine flows stable, up to 15 MGD • Sewage highly variable flow: 2 – 100 MGD • Near field dilutions average 200:1, min. of 9:1 • Far field dilutions in San Rafael Bay of 1500:1
Size of the Initial Mixing Zone Worst Case: 650m x 250m Mean: 30m x 15m
Brine Mixture Bioassays • Acute bioassays on mysid shrimp, topsmelt, marine algae at 79%, 27% and 5% brine • No significant impacts • Chronic bioassays on giant kelp, bay mussel, inland silverside at 79% and 27% brine • No significant impacts under EPA protocol (correct salinity) • Sublethal impacts for high-brine mix • No major differences from sewage effluent alone
Water Supply Analysis • Testing for: • 100 Regulated compounds or compounds that require monitoring • 250 non-regulated compounds • An additional 100 non-regulated compounds specific to SF Bay (incl. flame retardants, algal toxins) • E-screen bioassay • 6,000 Data Points to Evaluate Water Quality and Treatment Performance
Desalinated Water Quality Results Detailed List of Constituent Sample Results Available a - ppm b – Federal Secondary (aesthetic) Standard c – based on MMWD source water quality d – CA DHS notification level e – 4 of 5 samples tested non-detect
100 Watts avg. 75 Watts 100 Watts 140 Watts 2.4 kWh/day 1.8 kWh/day 3.4 kWh/day 2.4 kWh/day Energy for Desalting Seawater is Similar to Common Appliances On average,MMWD households use 270 gallons of water per day 81 Watts 1.9 kWh/day At 7.15 kWh/1000 gal seawater desalination requires only 1.9 kWhr/day of power to produce 270 gallons per day.
Desal would be approx. 0.7% to 3% of Annual Marin Energy Use * From California Energy Commission for year 2000
Desal Energy is like an extra lightbulb in every Marin home • Average operation would be like an extra compact fluorescent bulb on all the time • Drought operation would be like a standard 100-W bulb on all the time • MMWD will be considering renewable power to supply this energy need
Desalination facility: $81-121 million Non-construction costs (permitting, construction management, etc.): $7-10 million In-system distribution improvements (Phases IV and V): $22 - 42 million Total $110 - 173 million Annual operating costs: $4 – 12 million Normalized cost: $2,433 - $2,023 per acre-foot Cost of Desalination Option