1 / 6

Product A Outselling Product B in All Regions Infographics

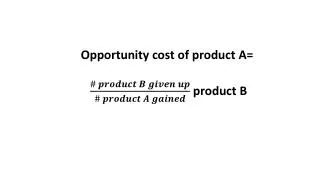
Explore the data showing how Product A surpasses Product B in sales across all Regions year by year. Detailed comparison of growth rates in Region A, Region B, and Region C in 2009.

deacon
Download Presentation

Product A Outselling Product B in All Regions Infographics

An Image/Link below is provided (as is) to download presentation Download Policy: Content on the Website is provided to you AS IS for your information and personal use and may not be sold / licensed / shared on other websites without getting consent from its author. Content is provided to you AS IS for your information and personal use only. Download presentation by click this link. While downloading, if for some reason you are not able to download a presentation, the publisher may have deleted the file from their server. During download, if you can't get a presentation, the file might be deleted by the publisher.

E N D

Presentation Transcript


  1. PowerpointInfographics Product A is outselling Product B in all Regions No matter what the Region is, product a outperforms product b yearbyyear. REGION A REGION B REGION C Product A has grownwith 160% in 2009 Product B has grownwith 130% in 2009 Product B has grownwith 130% in 2009

  2. PowerpointInfographics

  3. PowerpointInfographics

  4. PowerpointInfographics

  5. PowerpointInfographics

  6. PowerpointInfographics

More Related