Download
1 / 3
30 likes | 145 Views
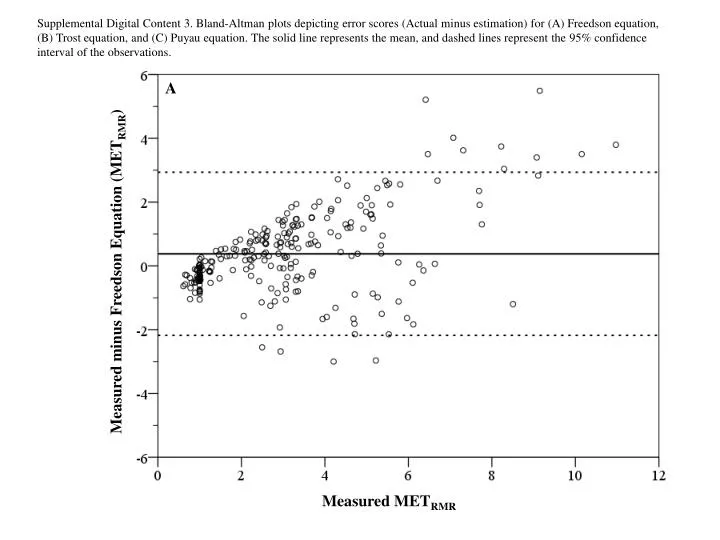
This study utilizes Bland-Altman plots to illustrate error scores, specifically the differences between actual and estimated values for physical activity assessments. Error scores are compared among three widely used equations: the Freedson equation, the Trost equation, and the Puyau equation. The solid line in each plot indicates the mean error, while the dashed lines represent the 95% confidence intervals of the observations, providing insights into the reliability and accuracy of each equation in estimating metabolic equivalent task rates.

E N D
Supplemental Digital Content 3. Bland-Altman plots depicting error scores (Actual minus estimation) for (A) Freedson equation, (B) Trost equation, and (C) Puyau equation. The solid line represents the mean, and dashed lines represent the 95% confidence interval of the observations. Measured minus Freedson Equation (METRMR) A Measured METRMR
B Measured minus Trost Equation (METRMR) Measured METRMR
C Measured minus Puyau Equation (METRMR) Measured METRMR