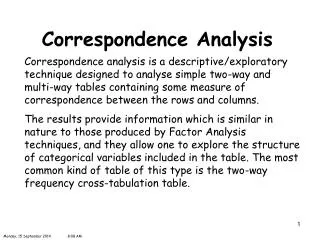
Correspondence Analysis
Correspondence Analysis. Multivariate Chi Square. Goals of CA. Produce a picture of multivariate data in one or two dimensions Analyze rows and columns simultaneously Plot both on a single scale Often shows chronological ordering. Data.


Correspondence Analysis
E N D
Presentation Transcript
Correspondence Analysis Multivariate Chi Square
Goals of CA • Produce a picture of multivariate data in one or two dimensions • Analyze rows and columns simultaneously • Plot both on a single scale • Often shows chronological ordering
Data • Counts or presence/absence for a series of cases or observations (rows) by a number of variables (columns) • Composition data: assemblage, pollen, botanical, faunal, trace elements, etc
Dimensions • CA works by extracting orthogonal dimensions from the data table (similarly to principal components) • Typically one or 2 dimensions are extracted but the maximum number of dimensions is min[(rows-1), (columns-1)]
Plotting • CA produces coordinates for each dimension for each row and column in the original data • On the plot, the distance between two row points or two column points reflects their similarity or difference • Row points help to understand the patterns of column points and vice versa
N. C. Nelson. 1916. Chronology of the Tano Ruins, New Mexico. American Anthropologist 18(2): 159-180. > round(prop.table(as.matrix(Nelson[,2:8]),1)*100,2) Corrugated Biscuit Type_IType_II_RedType_II_YellowType_II_GrayType_III 1 36.77 6.45 1.29 15.48 14.84 21.94 3.23 2 31.27 4.58 0.54 17.25 24.26 20.49 1.62 3 15.34 1.14 5.68 38.64 10.23 27.27 1.70 4 21.37 3.05 4.58 39.69 15.27 16.03 0.00 5 17.39 4.35 0.58 37.10 15.94 24.64 0.00 6 18.66 5.22 1.99 47.76 13.18 12.94 0.25 7 23.14 4.37 17.47 39.74 8.73 6.55 0.00 8 24.67 0.88 51.98 19.82 0.44 2.20 0.00 9 45.59 0.49 52.45 1.47 0.00 0.00 0.00 10 54.55 0.65 44.81 0.00 0.00 0.00 0.00
> CaModel.1 <- corresp(Nelson[,2:8], nf=2) > CaModel.1 First canonical correlation(s): 0.6597448 0.2920078 Row scores: [,1] [,2] 1 0.46210940 -1.7012147 2 0.60419349 -1.5122232 3 0.61729088 0.3932446 4 0.53546269 0.4828572 5 0.79817759 0.2253562 6 0.66325251 0.9763632 7 -0.07289875 1.0187273 8 -1.53206047 0.9932521 9 -1.89221367 -0.4542234 10 -1.72783895 -0.9356060
Column scores: [,1] [,2] Corrugated -0.4321891 -0.9113879 Biscuit 0.6712457 -0.2200843 Type_I -2.0277828 0.5029450 Type_II_Red 0.6086514 1.3687118 Type_II_Yellow 0.8817724 -0.8926234 Type_II_Gray 0.8845662 -0.5461081 Type_III 0.8539497 -3.5212105
> str(CaModel.1) List of 4 $ cor : num [1:2] 0.66 0.292 $ rscore: num [1:10, 1:2] 0.462 0.604 0.617 0.535 0.798 ... ..- attr(*, "dimnames")=List of 2 .. ..$ : chr [1:10] "1" "2" "3" "4" ... .. ..$ : NULL $ cscore: num [1:7, 1:2] -0.432 0.671 -2.028 0.609 0.882 ... ..- attr(*, "dimnames")=List of 2 .. ..$ : chr [1:7] "Corrugated" "Biscuit" "Type_I” ... .. ..$ : NULL $ Freq : num [1:10, 1:7] 57 116 27 28 60 75 53 56 93 84 ... ..- attr(*, "dimnames")=List of 2 .. ..$ Row : chr [1:10] "1" "2" "3" "4" ... .. ..$ Column: chr [1:7] "Corrugated" "Biscuit" "Type_I" ... - attr(*, "class")= chr "correspondence“ > biplot(CaModel.1, xlim=c(-1, .75)) > plot(CaModel.1$rscore, type="c") > text(CaModel.1$rscore, as.character(1:10))
More Details • Package ca provides more statistics regarding the fit • install.packages("ca") • library(ca) • CaModel.2 <- ca(Nelson[,2:8]) • CaModel.2 • summary(CaModel.2) • plot(CaModel.2, xlim=c(-1.3, .8))
CA Terminology 1 • Principal Inertias (eigenvalues) – a measure of the inertia (chi square deviation from the mean) explained by each dimension • Mass – The weight of each row/col in the analysis (the proportion of cases in that row/column)
CA Terminology 2 • ChiDist – how much a profile (row or column) differs from the mean profile • Inertia –deviation from average for this row/col • Dim. – the scores for each axis
summary() output 1 • mass = Mass*1000 • qlt = (quality) how well the r/c is represented • inr = Inertia*1000 • cor = (relative contribution to inertia) contribution to quality for that dimension
summary() output 2 • ctr = (absolute contribution to inertia) proportion of r/c inertia for that dimension