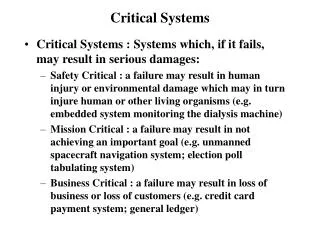
Reliability Validation and Safety Assurance in Critical Systems
Learn about reliability measurement, safety arguments, and validation costs for critical systems. Topics include operational profiles, statistical testing, and reliability growth models.


Reliability Validation and Safety Assurance in Critical Systems
E N D
Presentation Transcript
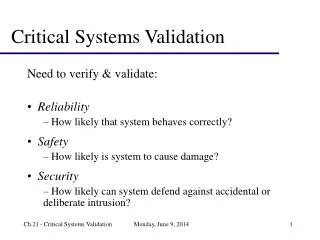
Critical Systems Validation IS301 – Software Engineering Lecture # 32 – 2004-11-15 M. E. Kabay, PhD, CISSP Assoc. Prof. Information AssuranceDivision of Business & Management, Norwich University mailto:mkabay@norwich.edu V: 802.479.7937
Objectives • To explain how system reliability can be measured and how reliability growth models can be used for reliability prediction • To describe safety arguments and how these are used • To discuss the problems of safety assurance • To introduce safety cases and how these are used in safety validation
Topics covered • Reliability validation • Safety assurance • Security assessment • Safety and dependability cases
Validation of critical systems • The verification and validation costs for critical systems involves more validation processes and analysis than for non-critical systems: • The costs and consequences of failure are high so it is cheaper to find and remove faults than to pay for system failure; • You may have to make a formal case to customers or to a regulator that the system meets its dependability requirements. This dependability case may require specific V & V activities to be carried out.
Validation costs • Because of the additional activities involved, the validation costs for critical systems are usually significantly higher than for non-critical systems. • Normally, V & V costs take up more than 50% of the total system development costs.
Reliability validation • Reliability validation involves exercising the program to assess whether or not it has reached the required level of reliability. • This cannot normally be included as part of a normal defect testing process because data for defect testing is (usually) atypical of actual usage data. • Reliability measurement therefore requires a specially designed data set that replicates the pattern of inputs to be processed by the system.
Reliability validation activities • Establish the operational profile for the system. • Construct test data reflecting the operational profile. • Test the system and observe the number of failures and the times of these failures. • Compute the reliability after a statistically significant number of failures have been observed.
Statistical testing • Testing software for reliability rather than fault detection. • Measuring the number of errors allows the reliability of the software to be predicted. Note that, for statistical reasons, more errors than are allowed for in the reliability specification must be induced. • An acceptable level of reliability should be specified and the software tested and amended until that level of reliability is reached.
Reliability measurement problems • Operational profile uncertainty • The operational profile may not be an accurate reflection of the real use of the system. • High costs of test data generation • Costs can be very high if the test data for the system cannot be generated automatically. • Statistical uncertainty • You need a statistically significant number of failures to compute the reliability but highly reliable systems will rarely fail.
Operational profiles • An operational profile is a set of test data whose frequency matches the actual frequency of these inputs from ‘normal’ usage of the system. A close match with actual usage is necessary otherwise the measured reliability will not be reflected in the actual usage of the system. • It can be generated from real data collected from an existing system or (more often) depends on assumptions made about the pattern of usage of a system.
Operational profile generation • Should be generated automatically whenever possible. • Automatic profile generation is difficult for interactive systems. • May be straightforward for ‘normal’ inputs but it is difficult to predict ‘unlikely’ inputs and to create test data for them.
Reliability prediction • A reliability growth model is a mathematical model of the system reliability change as it is tested and faults are removed. • It is used as a means of reliability prediction by extrapolating from current data • Simplifies test planning and customer negotiations. • You can predict when testing will be completed and demonstrate to customers whether or not the reliability growth will ever be achieved. • Prediction depends on the use of statistical testing to measure the reliability of a system version.
Observed reliability growth • The equal-step growth model is simple but it does not normally reflect reality. • Reliability does not necessarily increase with change as the change can introduce new faults. • The rate of reliability growth tends to slow down with time as frequently occurring faults are discovered and removed from the software. • A random-growth model where reliability changes fluctuate may be a more accurate reflection of real changes to reliability.
Note different reliability improvements Fault repair adds new faultsand decreases reliability (increases ROCOF) Random-step reliability growth
Growth model selection • Many different reliability growth models have been proposed. • There is no universally applicable growth model. • Reliability should be measured and observed data should be fitted to several models. • The best-fit model can then be used for reliability prediction.
Reliability prediction Measured reliability Reliability Fitted reliability model curve RequiredReliability Estimated time ofreliability achievement
Homework • Required • By Mon 29 Nov 2004 • For 20 points, • 24.2 (@4), • 24.4 (@12)—details!, • 24.5 (@4) • Optional • By Wed 1 Dec 2004 • For a maximum of 5 points, • 24.11 – THINK about it before you write