Download
1 / 28
280 likes | 298 Views
Explore climate change impacts on forests in a NYC water supply watershed using RHESSys model enhancements.

E N D
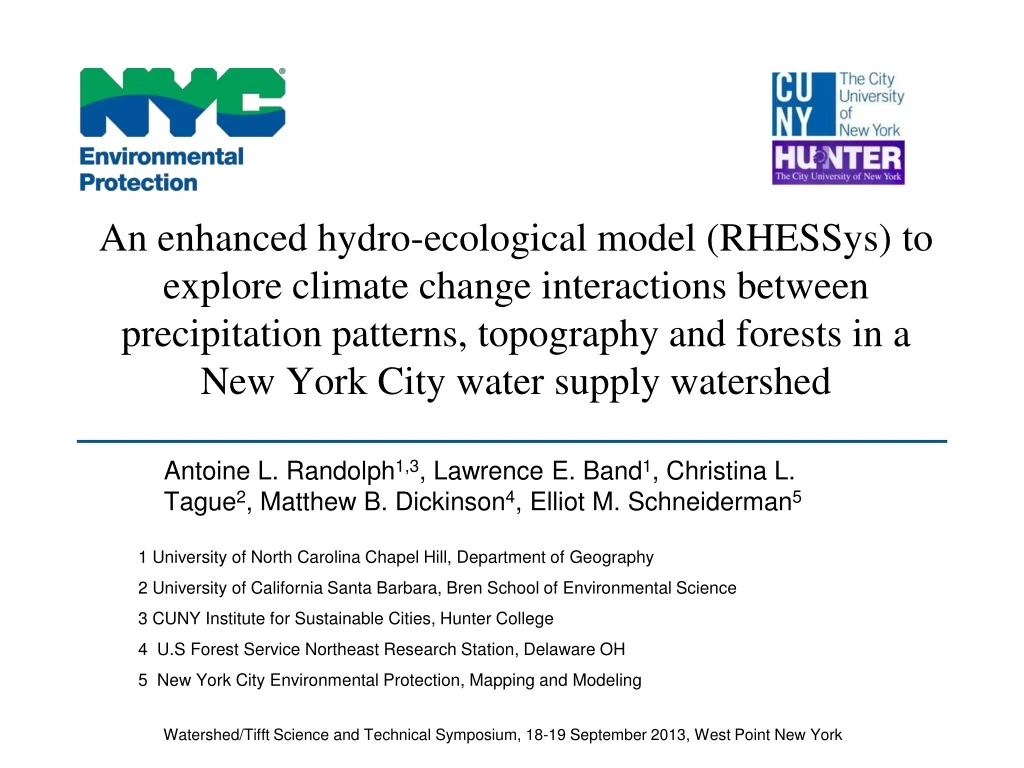
An enhanced hydro-ecological model (RHESSys) to explore climate change interactions between precipitation patterns, topography and forests in a New York City water supply watershed Antoine L. Randolph1,3, Lawrence E. Band1, Christina L. Tague2, Matthew B. Dickinson4, Elliot M. Schneiderman5 • 1 University of North Carolina Chapel Hill, Department of Geography 2University of California Santa Barbara, Bren School of Environmental Science 3CUNY Institute for Sustainable Cities, Hunter College • 4 U.S Forest Service Northeast Research Station, Delaware OH • 5 New York City Environmental Protection, Mapping and Modeling Watershed/Tifft Science and Technical Symposium, 18-19 September 2013, West Point New York
Presentation Outline • Hydro-ecological models as management tools • A brief overview of RHESSys • Enhancements to the baseline version of RHESSys • Implementation of RHESSys for Biscuit Brook • Examples of Biscuit Brook model output • Future research and development
Hydro-ecological models as management tools tools • Can be used to forecast the potential impacts of climate change on forest structure and composition: • changes in the frequency of extreme weather events • wind damage, ice damage, flooding • canopy damage • change in precipitation patterns • increased stress • greater susceptibility to insects and pathogens • decrease in the viability of seed • changes in the distribution of tree species • habitat loss • loss of commercially important tree species • Changes in forest cover can affect the quantity and quality of stream flow • increased erosion, turbidity and nutrient loading • changes in the spatial and temporal availability of water
RHESSys genealogy (RHESSys)
RHESSys Specifics • Regional Hydro-Ecological Simulation System • GIS-based model • Spatially distributed • Hierarchical/Nested • Watershed model • small scale (e.g., a 10,000m2 catchment, 1st order streams) • regional scale (e.g., a 1000km2 basin, 4th order streams) • minimum pixel (i.e., landscape patch) size 5 to 10m2 • Process model • ecological processes (e.g., photosynthesis) • hydrological processes (e.g., infiltration, run-off) • explicit routing (fully distributed – extended from DHSVM routing) • Topmodel(quasi-distributed based on wetness index)
Vegetation modeling Tree dimensions define zones of influence for each species, within which the characteristics of the tree modify local microclimate. Canopy dominant trees function as “Keystone species.”
RHESSys modeling enhancements (highlights) • explicit modeling of tree species • leaf C/N ratio, specific leaf area, environmental tolerances, dynamic leaf phenology • explicit modeling of tree growth and dimensions • trunk diameter, height growth curve, rooting depth, bark thickness, crown base height, stem counts, basal area • addition of a litter layer structure • L, F and H litter layer depths and moisture • transpiration from the H layer and mineral soil • implementation of fire modeling • fire spread based on Rothermel’s mathematical model • fire mortality based on bark thickness
Overview of RHESSys worldfile creation • Time series for minimum temperature, maximum temperature and daily precipitation are the minimum required climatic inputs. Soil and vegetation characteristics are specified via parameter definition (*.def) files. The GIS-based preprocessing step allows broad flexibility in partitioning the landscape (i.e., basins, hillslopes, micro-climatic zones, landscape patches).
Model Calibration • hydrological calibration • modeled stream flow vs. actual stream flow data • modeled soil moisture vs. actual soil moisture data • modeled evapo-trans vs. actual evapo-trans data • vegetation calibration • modeled height or DBH growth vs. actual growth • modeled leaf area index vs. actual leaf area index • modeled basal area per hectare vs. actual basal area • modeled biomass accumulation vs. actual accumulation • snow pack calibration (under development)
Examples of RHESSys model output for Biscuit Brook (un-calibrated modeling results)
Terrain analysis example 1 The western portion of the ridgeline and upslope region of Biscuit Brook with 2m contours. Steep outcrops surrounding relatively flatter terrain is prominent at this location, as indicated by the outlined areas.
Terrain analysis example 2 Overlay of wetness index and the derived stream network (blue lines) suggests that low lying upslope areas (i.e., shelves) are often at the source of 1st order streams. Alternating soggy and dry conditions could lead to nutrient loading in1st order streams, depending on vegetation type and status.
Modeled Snow Pack SWE example 1 March 1999: spatial variability in mean monthly snow pack SWE is high but the mean monthly SWE quantity is low. snow water equivalent (SWE) mm
Modeled Snow Pack SWE example 2 Jan 1999: spatial variability in mean monthly snow pack SWE is low but the mean monthly SWE quantity is high. snow water equivalent (SWE) mm
Summary/Conclusions • Take Home Messages • Simulations are sensitive to species • Simulations are sensitive to precipitation pattern • Spatially adjusted snow modeling output • individual components of snow pack loss • Future Work • Add additional local tree species • Model calibration • Expand scale of modeling (e.g., Neversink basin) • Use the calibrated model to investigate the effects of climate change on Catskill forests
Acknowledgements Thanks to my fellow CUNY postdocs for their encouragement and expertise. Thanks to DEP Modeling Group staff for their feedback and help finding necessary data. Special thanks to Larry Band for his continued support and guidance