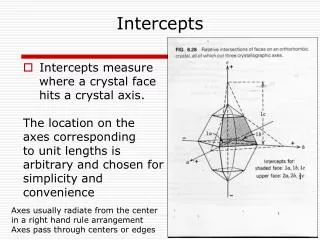
Download
1 / 15
150 likes | 179 Views
Learn to find x- and y-intercepts, graph lines, and understand the relationship between rates of change and slopes in mathematics. Practice identifying variables and calculating rates of change from tables and graphs.

E N D
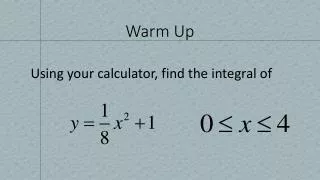
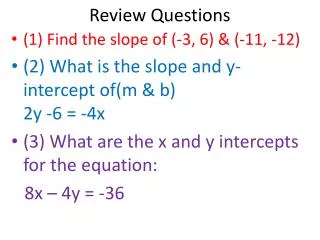
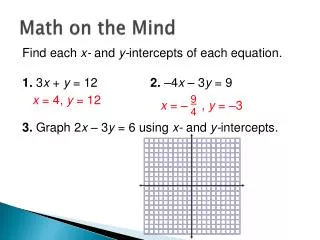
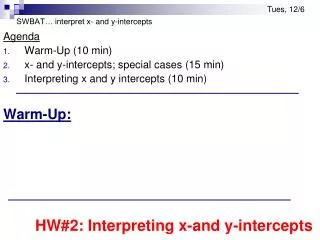
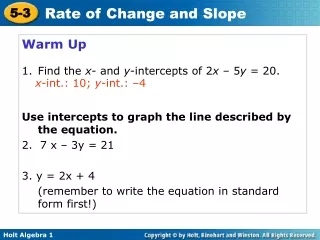
Warm Up • Find the x- and y-intercepts of 2x – 5y = 20. • Use intercepts to graph the line described by the equation. • 2. 7 x – 3y = 21 • 3. y = 2x + 4 • (remember to write the equation in standard form first!) x-int.: 10; y-int.: –4
Objectives Find rates of change and slopes. Relate a constant rate of change to the slope of a line.
Vocabulary rate of change rise run slope
A rate of change is a ratio that compares the amount of change in a dependent variable to the amount of change in an independent variable.
Directions: 1. Determine the independent and dependent variable. 2. Find the rate of change. 3. Answer the question.
Example 1 The table shows the average temperature (°F) for five months in a certain city. Find the rate of change for each time period. During which time period did the temperature increase at the fastest rate? Step 1 Identify the dependent and independent variables. dependent: temperatureindependent: month
2 to 3 3 to 5 5 to 7 7 to 8 Example 1 Continued Step 2 Find the rates of change. The temperature increased at the greatest rate from month 5 to month 7.
Example 2 The table shows the balance of a bank account on different days of the month. Find the rate of change during each time interval. During which time interval did the balance decrease at the greatest rate? Step 1 Identify the dependent and independent variables. dependent: balanceindependent: day
1 to 6 6 to 16 16 to 22 22 to 30 Example 2 Continued Step 2 Find the rates of change. The balance declined at the greatest rate from day 6 to day 16.
Example 3 Graph the and show the rates of change. Graph the ordered pairs. The vertical segments show the changes in the dependent variable, and the horizontal segments show the changes in the independent variable. Notice that the greatest rate of change is represented by the steepest of the red line segments.
Example 3 Continued Also notice that between months 2 to 3, when the balance did not change, the line segment is horizontal.
Example 4 Graph the ordered pairs. The vertical segments show the changes in the dependent variable, and the horizontal segments show the changes in the independent variable. Notice that the greatest rate of change is represented by the steepest of the red line segments.
Example 4 Continued Also notice that between days 16 to 22, when the balance did not change, the line segment is horizontal.
Lesson Summary Name each of the following. 1. The table shows the number of bikes made by a company for certain years. Find the rate of change for each time period. During which time period did the number of bikes increase at the fastest rate? 1 to 2: 3; 2 to 5: 4; 5 to 7: 0; 7 to 11: 3.5; from years 2 to 5