Download
1 / 49
490 likes | 576 Views
Genome Comparisons and Gene Regulation. Penn State University, Center for Comparative Genomics and Bioinformatics: Webb Miller, Francesca Chiaromonte, Anton Nekrutenko, Ross Hardison; James Taylor, David King, Hao Wang University of California at Santa Cruz: David Haussler, Jim Kent

E N D
Genome Comparisons and Gene Regulation Penn State University, Center for Comparative Genomics and Bioinformatics: Webb Miller, Francesca Chiaromonte, Anton Nekrutenko, Ross Hardison; James Taylor, David King, Hao Wang University of California at Santa Cruz: David Haussler, Jim Kent National Human Genome Research Institute: Laura Elnitski Children’s Hospital of Philadelphia: Mitch Weiss Lawrence Livermore National Laboratory: Ivan Ovcharenko CSH Nov. 6, 2005
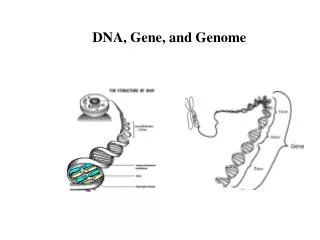
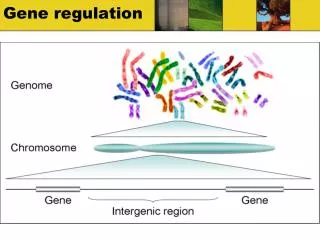
DNA sequences of mammalian genomes • Human: 2.9 billion bp, “finished” • High quality, comprehensive sequence, very few gaps • Mouse, rat, dog, oppossum, chicken, frog etc. etc etc. • About 40% of the human genome aligns with mouse • This is conserved, but not all is under selection. • About 5-6% of the human genome is under purifying selection since the rodent-primate divergence • About 1.5%codes for protein • The 4.5% of the human genome that is under selection but does not code for protein should have: • Regulatory sequences • Non-protein coding genes • Other important sequences
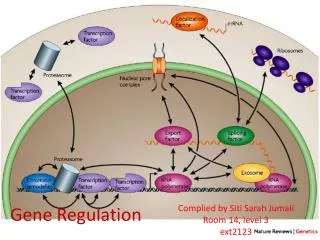
Transcription initiation and pausing Repressors bind to negative control elements General transcription initiation factors, GTIFs Assemble on promoter
Basal and activated transcription Activators bind to enhancers
Pol IIa Contact for activation Enhancer IID PolII Promoter Coactivators Coactivators and/or activators sometimes recruit enzymes that modify chromatin structure to facilitate transcription. Histone acetylation Nucleosome remodeling
Promoter for RNA Polymerase II DPE Regulate efficiency at which minimal promoter is used Minimal promoter: binding of GTIFs and RNA Pol II Bad news for prediction: TATA box is moderately well-defined, but in large datasets of mammalian promoters, only about 11% have TATA boxes ! Inr (YANWYY) and DPE are not well-defined sequences. Good news for prediction of promoters: About 70% are in CpG islands Almost all encompass the 5’ end of genes
Enhancers: Specific DNA sequences that cause an increase in transcription • Can act in a variety of positions: • 5’ to gene (similar to an upstream activation sequence) • Internal to a gene (e.g. in an intron) • 3’ to a gene • Can act at a considerable distance from the gene • Current studies implicate enhancers as far as 200kb to 500kb away from genes. • Other genes can be between an enhancer and its target gene. • Contain a set of binding sites for transcriptional activators. • Sequence-specific binding sites • Short: roughly 6-8bp
Many regulatory DNA sequences in SV40 control region Sequence-specific
Domainopening is associated with movement to non-hetero-chromatic regions
Expected properties of regulatory elements • Conserved between species • Examine interspecies alignments • Enhancers and promoters: clusters of binding sites for transcription factors • Use TRANSFAC, TESS, MOTIF (GenomeNet), etc to find matches to binding sites for transcription factors • Binding sites conserved between species • Servers to find conserved matches to factor binding sites • Comparative genomics at Lawrence Livermore http://www.dcode.org/ • zPicture and rVista • Mulan and multiTF • ECR browser • Consite http://mordor.cgb.ki.se/cgi-bin/CONSITE/consite • The database GALA records conserved (and nonconserved) matches to factor binding sites (http://www.bx.psu.edu/) • Can be almost anywhere • 5’ or 3’ to gene • Within introns • Close or far away
Conservation score S in different types of regions Red: Ancestral repeats (mostly neutral) Blue: First class in label Green: Second class in label Waterston et al., Nature
Use measures of alignment texture to discriminate functional classes of DNA • Mouse Cons track (L-scores) and phastCons are measures of alignment quality. • Match > Mismatch > Gap • Alternatively, can analyze the patterns within alignments (texture) to try to distinguish among functional classes • Regulatory regions vs bulk DNA • Patterns are short strings of matches, mismatches, gaps • Find frequencies for each string using training sets • 93 known regulatory regions • 200 ancestral repeats (neutral) • Regulatory potential genome-wide • Elnitski et al. (2003) Genome Research 13: 64-72.
What types of regulatory sequences may we hope to find? • Sequence signature: specific binding sites • Promoters • Enhancers • Repressor binding sites • But these “signatures” are short and occur frequently in any long sequence • Sequence signature unknown, maybe none • Compact, silent chromatin • Insulators, boundaries • Release from pausing • Movement from inactive to active compartments
5% Coverage of human by alignments with other vertebrates ranges from 1% to 91% Human 5.4 Millions of years 91 92 173 220 310 360 450
Neutral DNA “cleared out” over 200Myr Platypus Chick Frog Fish Opossum Mouse, Rat Cow Dog Chimp Most human DNA is not alignable to species separated by more than 200 yr. Divergence dates from Kumar and Hedges (Nature 1998) and Hedges (Nature Rev Genet 2002)
Distinctive divergence rates for different types of functional DNA sequences
Large divergence in cis-regulatory modules from opossum to platypus
Marsupial genome adds substantially to the conserved fraction of regulatory regions
The distal Major regulatory element of the human HBA gene complex is conserved in opossum but not beyond
cis-Regulatory modules conserved from human to fish • About 20% of CRMs • Tend to regulate genes whose products control transcription and development • Recent reports: • Sandelin, A. et al. (2004). BMC Genomics5: 99. • Woolfe, A. et al. (2005). PLoS Biol3: e7 • Plessy, C., Dickmeis, T., Chalme,l F., Strahle, U. (2005) Trends Genet. 21: 207-10. Millions of years 91 173 310 450
cis-Regulatory modules conserved from human to chicken • About 40% of CRMs • Noncoding sequences conserved from human to chicken tend to clusters in gene-poor regions • Conservation jungles • Hillier et al. (2004) Nature • Stable gene deserts are conserved from human to chicken • Ovcharenko et al., (2005) Genome Res. 15: 137-145. • Conserved noncoding sequences in stable gene deserts tend to be long-range enhancers • Nobrega, M.A., Ovcharenko, I., Afzal, V., Rubin, E.M. (2003) Science 302: 413. Millions of years 91 173 310 450
cis-Regulatory modules conserved in eutherian mammals (and marsupials?) • About 80-90% of CRMs • Within aligned noncoding DNA of eutherians, need to distinguish constrained DNA (purifying selection) from neutral DNA. Millions of years 91 173 310 450
Score multi-species alignments for features associated with function • Multiple alignment scores • Binomial, parsimony (Margulies et al., 2003) • PhastCons • Siepel and Haussler, 2003; Siepel et al. 2005 • Phylogenetic Hidden Markov Model • Posterior probability that a site is among the 10% most highly conserved sites • Allows for variation in rates and autocorrelation in rates • Factor binding sites conserved in human, mouse and rat • Tffind (from M. Weirauch, Schwartz et al., 2003) • Score alignments by frequency of matches to patterns distinctive for CRMs • Regulatory potential (Elnitski et al., 2003; Kolbe et al., 2004)
H M R Binding sites conserved between species • tffind: Identify high-quality matches to a weight matrix in one sequence (e.g. human) that also aligns with other sequences (e.g. mouse and rat) • Look for matches to weight matrix in 2nd and 3rd sequences, in the part of the alignment that aligns to match to weight matrix in first species • GALA records these matches Program does not find this, but some studies show that it can happen. Matt Weirach
Conserved transcription factor binding sites • Track on UCSC Genome Browser (human) • GALA (www.bx.psu.edu) • rVista • Can export alignments from zPicture and Mulan • ECR browser • All at dcode.org • ConSite
Use measures of alignment texture to discriminate functional classes of DNA • Compute the probability of matching a pattern characteristic of regulatory regions • Analyze alignments as short strings of matches, mismatches, gaps • Find probabilities for each string using as training sets • 93 known regulatory regions • 200 ancestral repeats (neutral) • Construct Markov models that give good separation of regulatory regions from neutral DNA • Regulatory potential of all 100 bp windows in the genome
RP of any 3-way alignment is the sum of the log likelihood ratios of finding the strings of alignment characters in known regulatory regions vs. ancestral repeats. Computing Regulatory Potential (RP) Alignment seq1 G T A C C T A C T A C G C A seq2 G T G T C G - - A G C C C A seq3 A T G T C A - - A A T G T A Collapsed alphabet 1 2 1 3 4 5 7 7 6 8 3 6 3 9 • A 3-way alignment has 124 types of columns. Collapse these to a smaller alphabet with characters s (for example, 1-9). • Train two order t Markov models for the probability that t alignment columns are followed by a particular column in training sets: • positive (alignments in known regulatory regions) • negative (alignments in ancestral repeats, a model for neutral DNA) • E.g. Frequency that 3 4 is followed by 5: • 0.001 in regulatory regions • 0.0001 in ancestral repeats
RP and phastCons in HBB locus control region HBB HBD HBG2 HBG1 HBE LCR - Both RP and phastCons are high in exons - RP peaks in many cis-regulatory modules - phastCons peaks in more regions http://genome.ucsc.edu/
More species and better models improve discriminatory power of RP scores ROC curves for different RP scores, tested on a set of known regulatory regions from the HBB gene complex
RP and phastCons can discriminate most known functional elements from neutral DNA
Leveraging genome evolution to discover function • Overall goals and core concepts • All-vs-all whole-genome comparisons • Comparison of no two species is ideal for finding all functional sequences • Alignment scores: • Aid in finding functional elements • Discriminate between functional classes • Example of experimental tests of the bioinformatic predictions
repressed induced genes time after restoration of GATA-1 Genes co-expressed in late erythroid maturation • G1E-ER cells: proerythroblast line from mice lacking the transcription factor GATA-1. • Can restore the activity of GATA-1 by expressing an estrogen-responsive form of GATA-1 • Allows cells to mature further to erythroblasts • Use microarray analysis of each to find genes that increase or decrease expression upon induction. • Walsh et al., (2004) BLOOD; Image from k-means cluster, GEO:
Predicting cis-regulatory modules (preCRMs) Identify a genomic region with a regulated gene. Find all intervals whose RP score exceeds an empirical threshold. Subtract exons Find all matches to GATA-1 binding sites that are conserved (cGATA-1_BS) Intervals with RP scores above the threshold and with a cGATA-1_BS within 50bp are preCRMs.
Predicted cis-regulatory modules (preCRMs) around erythroid genes + -
test HBG FF luciferase prom Dual luciferase assay tk Ren luciferase prom K562 cells Test predicted cis-regulatory modules (preCRMs) • Enhancement in transient transfections of erythroid cells • Activation and induction of reporter genes after site-directed, stable integration in erythroid cells • Chromatin immunoprecipitation (ChIP) for GATA-1
Negative controls do not enhance transient expression Negative controls are segments of mouse DNA that align with rat and human but have low RP scores and do not have a match to a GATA-1 binding site. They have almost no effect on the level of expression of the reporter gene in erythroid cells.
9 of 24 Zfpm1 preCRMs enhance after stable integration at RL5
All preCRMs in Gata2 are functional in at least one assay ChIP data are from publications from E. Bresnick’s lab.
About half of the preCRMs are validated as functional Assay Number Number % tested positive validated Transient 62 21 34 transfections Site-directed 62 21 34 integrants Either expression assay 62 33 53 GATA-1 ChIPs 17 11 65
Positive correlation between enhancer activity and regulatory potential
adult fetal embryonic locus control region Developmental regulation of the HBB gene complex transcription, in erythroid cells
High throughput DNase I hypersensitive sites find known regulatory regions R
Conclusions • Particular types of functional DNA sequences are conserved over distinctive evolutionary distances. • Multispecies alignments can be used to predict whether a sequence is functional (signature of purifying selection). • Alignments can be used to predict certain functional regions, including some cis-regulatory elements. • The predictions of cis-regulatory elements for erythroid genes are validated at a good rate. • Databases such as the UCSC Table Browser, GALA and Galaxy provide access to these data. • Expect improvements at all steps.
Many thanks … PSU Database crew: Belinda Giardine, Cathy Riemer, Yi Zhang, Anton Nekrutenko Wet Lab: Yuepin Zhou, Hao Wang, Ying Zhang, Yong Cheng, David King RP scores and other bioinformatic input: Francesca Chiaromonte, James Taylor, Shan Yang, Diana Kolbe, Laura Elnitski Alignments, chains, nets, browsers, ideas, … Webb Miller, Jim Kent, David Haussler Funding from NIDDK, NHGRI, Huck Institutes of Life Sciences at PSU