Download
1 / 19
190 likes | 527 Views
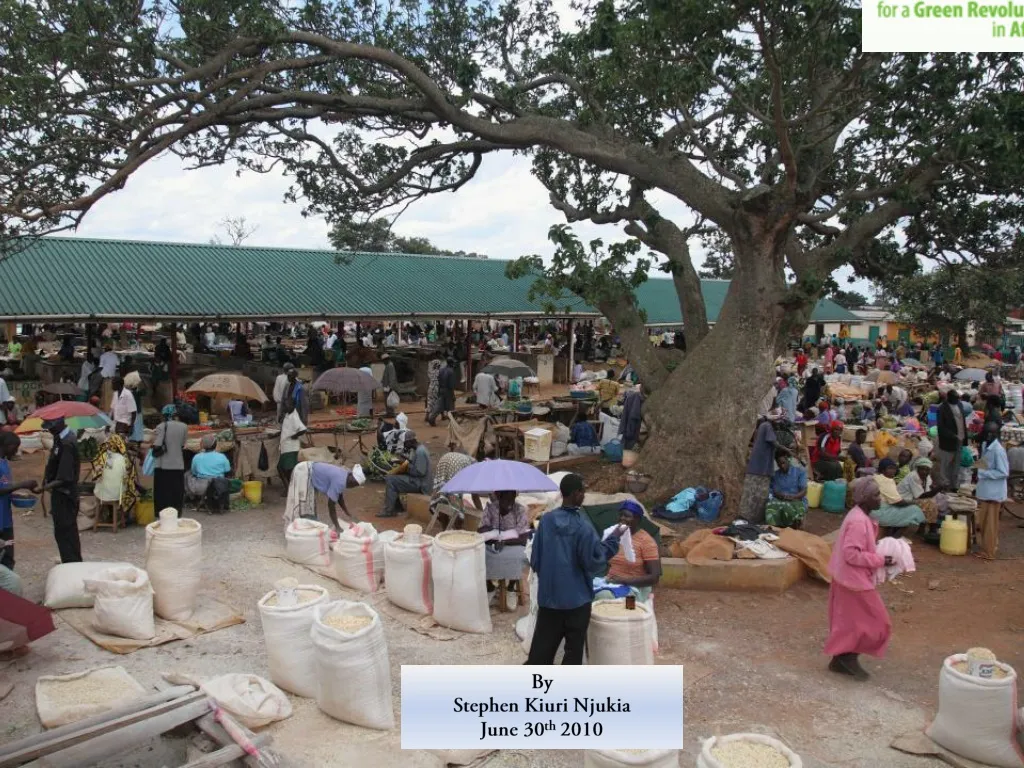
By Stephen Kiuri Njukia June 30 th 2010. Agricultural Trade in COMESA. I ntra-COMESA trade: US$9 billion; Extra-COMESA exports: US$90 billion ; Total trade US$160 billion US$3.6 billion (about 40%) of intra COMESA-trade is food and agricultural raw materials

E N D
By Stephen Kiuri Njukia June 30th 2010 1
Agricultural Trade in COMESA • Intra-COMESA trade: US$9 billion; • Extra-COMESA exports: US$90 billion ; • Total trade US$160 billion • US$3.6 billion (about 40%) of intra COMESA-trade is food and agricultural raw materials • 2004/2005: 11 countries were in food deficit and required imports from outside COMESA • 2005/2006: 5 countries were in food deficit but whole region had a surplus of 550,000. • 2006/2007: 2 countries were in food deficit but the region had a surplus of 1,500,000 MT.
Trade Flow Routes Prepared by Steve Njukia
Market Challenges in Africa • Traders, Processor and Consumers are seeking dependable supplies of grain and processed food of high quality at competitive prices throughout the year; • Price volatility leads to price risk • “Boom and burst” production cycles • Quality • produce deteriorates while stored (post harvest losses) • Economical Volume • Limited aggregation of produce • How do we ensure consistent surplus of produce to market?
Typical Kenya Maize Supply Cycle Peak harvest season Peak trading season Early harvest season High Supply Low Jan - Mar Apr - May June - Aug Sept-Nov Dec Prepared by Steve Njukia
Kenya Maize Demand Cycle Peak harvest season Peak trading season Early harvest season High Demand Low Jan - Mar Apr - May June - Aug Sept-Nov Dec Prepared by Steve Njukia
Ideal Supply Cycle through Regional trade Peak harvest season Peak trading season Early harvest season High Supply Low Jan - Mar Apr - May June - Aug Sept-Nov Dec Prepared by Steve Njukia
State of play in the staple food sector… • Problems facing the regional food markets have been known for over 50 years; they include: • High transport costs for both goods and people • Poor infrastructure • Transport costs account for the bulk of all food marketing costs in Africa, reaching as high as 54% in Ethiopia’s and 37% for Malawi’s grain markets (2003 study) • Inadequate storage facilities • High post harvest losses ;- up to 30% • harvest processes are underdeveloped because of lack of knowledge about proper drying practices and appropriate grading systems. • growth of mycotoxin (aflatoxin in Kenya)
State of play in the staple food sector… 3. Lack of market intelligence • traders lack information about the timing, quantity, and location marketable surpluses of grains 5. Limited value addition and lack of non-food usesof staple foods 6. Unpredictable policy environment Export ban;- Malawi, Ke, Tz, Zambia. Trading ban; Malawi 2008, Kenya 2008 7. Low productivity – Yield per hectare
Food Expenditure • Percentage of disposable income spent on food; • USA 7.2% • Canada 9% • India 33%, • Africa 75% • Given the above, our goal should be on how to reduce the cost of food through increased productivity and reduced post harvest losses.
Post harvest handling-Warehouse Receipt System (WRS) • Create choice – producers do not have to sell immediately after harvest • Get funds through loans for a crop without selling • Processors do not have to buy and store all commodity at once • Reward for storing crop well • Liquidity in local economy • Creation of a new type of collateral in a single document Peak harvest season = Low Prices Peak trading season= High Prices P2 Cost of Carry + margin P1 Begining Of Loan End Of Loan
Cereals value chain; KilomberoTz Traditional Trading Model Kilombero Rice WRS Farmers Farmers Village Collectors • aggregation of volume • Sorting • aggregation of volume • Sorting • Banks Finance Farmers directly • Farmers receive better margins Traders • Financing • Drying • Cleaning • Grading • Packaging • Storage Large Traders Processor Warehouse Receipt System
Policy factors affecting the flow of food staples in the region Frequent and unannounced changes in maize import tariff rates Export/Import bans Government price setting method Food Reserves purchasing and selling procedures – payment to farmers Regulations affecting private sector cereal marketing Reduced investments by private sector in storage due to policy uncertainty
Food value chain Service providers • Financiers • Agro-dealers • Aggregators • Drying • Cleaning • Grading • Packaging • Storage Input supplier Farmers • Losers • or • Winners ? Traders • Transporters • Equipment dealers Processors • Distributors • Kiosks • Supermarkets Consumers
Losers or winners? Examples • Kenya has just reduced the import duty on wheat • Wheat farmers held demonstrations on Monday 28th • Tanzania government imposes an export ban • Farmers in Kilombero unable to sell their rice at a profit • Malawi government set high farm-gate prices in 2009 • Limits the access to regional markets such as Kenya • Farmers income declines; unable to buy improved seeds and fertilizers • Food supply drops; consumer prices go up • Africa receives food aid; more money is spent on food import than would have been invested on improved productivity • Lack of investments in storage facilities and services reduces the ability for the government to know their food stock position
Conclusion • Where large increases in agricultural productivity occur without corresponding market access improvements, the outcome is dangerous for farmers: • Localized gluts which drive down prices • Farmers will as a result abandon new technologies • Low production will occur in the next season, driving up food prices • Our objective should be to boost smallholder farmers income while advancing overall food security by expanding market across multiple farming seasons and regions • Start your analyses from the Supply and Demand position at that particular point in time • Analyze the price trend • Understand the role of each sector player along the value chain • Create the awareness of a WIN! WIN! situation