Starfield
Starfield. Benefits of Primary Care: Evidence from International Comparisons of 13 Industrialized Countries. Starfield 09/02. The Countries, Mid-1990s. Australia (AUS) Belgium (BEL) Canada (CAN) Denmark (DK) Finland (FIN) France (FR) Germany (GER) Japan (JAP) Netherlands (NTH)

Starfield
E N D
Presentation Transcript
Benefits of Primary Care:Evidence from International Comparisons of 13 Industrialized Countries Starfield 09/02
The Countries, Mid-1990s Australia (AUS) Belgium (BEL) Canada (CAN) Denmark (DK) Finland (FIN) France (FR) Germany (GER) Japan (JAP) Netherlands (NTH) Spain (SP) Sweden (SWE) United Kingdom (UK) United States (US) Starfield
Primary Care Orientation of Health Systems: Rating Criteria • Health System Characteristics • Type of system • Financing • Type of primary care practitioner • Percent active physicians who are specialists • Professional earnings of primary care physicians relative to specialists • Cost sharing for primary care services • Patient lists • Requirements for 24-hour coverage • Strength of academic departments of family medicine Source: Starfield, 1998. Starfield
Primary Care Orientation of Health Systems: Rating Criteria • Practice Characteristics • First-Contact • Longitudinality • Comprehensiveness • Coordination • Family-centeredness • Community orientation Source: Starfield, 1998. Starfield
Primary Care Scores, 1980s and 1990s 1980s 1990s Belgium 0.8 0.4 France - 0.3 Germany 0.5 0.4 United States 0.2 0.4 Australia 1.1 1.1 Canada 1.2 1.2 Japan - 0.8 Sweden 1.2 0.9 Denmark 1.5 1.7 Finland 1.5 1.5 Netherlands 1.5 1.5 Spain - 1.4 United Kingdom 1.7 1.9 Starfield 2000
System and Practice CharacteristicsFacilitating Primary Care, Early-Mid 1990s GER FR BEL US SWE JAP CAN FIN AUS SP DK NTH UK Starfield 11/00
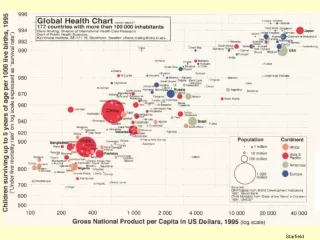
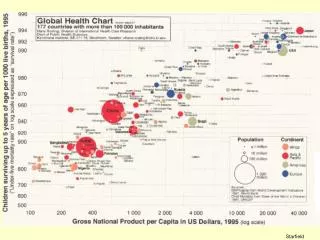
Health Care Expenditures per Capita, 1996 Starfield 2000
Primary Care Score vs. Health Care Expenditures, 1997 UK DK NTH FIN SP CAN AUS SWE JAP GER US BEL FR Starfield 10/00
International Comparisons:Birth Outcomes and Primary Care Score Primary Care Score Low Med High 14 11.5 12 9.5 10 Countries with weak primary care infrastructures have poorer health performance. 7.3 8 Average Rankings 5.5 6 4.8 4.6 4 2 Low: BEL, FR, GER, US Med: AUS, CAN, JAP, SWE High: DEN, FIN, NTH, SP, UK 0 Low BirthWeight Post Neonatal Mortality R= -.74; p<.001 R= -.38 NS Source: Starfield & Shi, 2002. Starfield 09/02
Average Rankings for Health Indicators, YPLL (Total and Suicide) in Countries Grouped by Primary Care Orientation All Except Suicide Suicide All Except External Female Male Female Male Female Male Lowest 9.5 10.8 7.3 8.3 8.8 10.8 (Belgium, France, Germany, US) Middle 3.8 2.8 7.0 7.3 3.8 3.5 (Australia, Canada, Japan, Sweden) Highest 7.6 7.4 6.8 5.8 8.2 7.0 (Denmark, Finland, Netherlands, Spain, UK) Source: OECD, 1998. Starfield 2000
Average Rankings for World Health Organization Health Indicators for Countries Grouped by Primary Care Orientation DALEs Child Survival Equity Overall Health Lowest (Belgium, France, Germany, US) 16.3 22.5 36.3 Middle* (Australia, Canada, Sweden, Japan) 4.8 16.5 26.0 29.1 11.0 15.8 Highest* (Denmark, Finland, Netherlands, Spain, UK) 16.0 15.2 31.6 Source: Calculated from WHO, 2000. Starfield 10/02
Primary Care Features Consistently Associated with Good/Excellent Primary Care • System features • Regulated resource distribution • Government-provided health insurance • No/low cost-sharing for primary care • Practice features • Comprehensiveness • Family orientation Starfield 10/01
Benefits of Primary Care:Within-Country Studies • Ecological analyses: Effect of primary care doctor to population ratios (US, UK) • Case control studies (US) • Hospitalizations for avoidable conditions or complications (US, Spain) • Survey data on impact of affiliation with a primary care doctor (US, Spain) • Path analyses at state and local levels (US) Starfield 09/02
Rates of Avoidable Pediatric Hospitalization for Diabetes Mellitus and Pneumonia and Family Physicians per 10,000 Population Source: Parchman & Culler, 1994. Starfield 10/02
. . . HI . . MN . . CT WA . ND MA . . . . NE . SD ID . OR CA . . ME . NH . . . AZ RI . . ID . . NM . MT . IA UT . NJ . . TN . . FL . WI KS NY . . TX AR . PA . MI DE KY . WV . . NC VA AL MD . IL MS . . NV . AK R=.54 P<.05 GA SC LA State Level Analysis:Primary Care and Life Expectancy PC physicians/population positively associated with longer life expectancy. Source: Shi et al., 1999. Starfield 03/02
Path Coefficients for the Effects of Income Inequality and Primary Care on Health Outcome: 50 US States, 1990 Total Mortality Infant Mortality .42** .35* -.36** -.29* Income Inequality (Robin Hood Index) -.33* Primary Care Physicians -.37** .58** Life Expectancy Low Birthweight .41** -.17 Source: Shi et al., 1999. *p<.05; **p<.01. Starfield
Path Coefficients for the Effects of Income Inequality and Primary Care on Health Outcome: 50 US States, 1990 Life Expectancy Total Mortality Neonatal Mortality .39** .40** -.35** -.38** -.18 Income Inequality (GINI COEFFICIENT) -.33* Primary Care Physicians .16 .18 .42** Stroke Mortality Postneonatal Mortality -.38** -.33* Life Expectancy Source: Shi et al., 1999. *p<.05; **p<.01. Starfield
Reductions in Inequality in Health by Primary Care: Self-Reported Health,60 US Communities, 1996 • Percent reporting fair or poor health • Areas with low income inequality • No effect of primary care resources* • Areas with moderate income inequality • 16% increase in areas with low primary care resources* • Areas with high income inequality • 33% increase in areas with low primary care resources* • *compared with median # of primary care physicians to population ratios Based on data in Shi & Starfield, 2000. Starfield 2000
Reductions* in Inequality in Health by Primary Care: Postneonatal Mortality,50 US States, 1990 Areas with low income inequality High primary care resources 0.8% decrease in mortality Low primary care resources 1.9% increase in mortality Areas with high income inequality High primary care resources 17.1% decrease in mortality Low primary care resources 6.9% increase in mortality *compared with population mean Based on data in Shi & Starfield, 2000. Starfield 2000
Low Birthweight among US Rural, Urban, and Health Center Infants US urban infants 8.8 Urban health center infants infants 7.5 Geographic area US rural infants 6.8 Rural health center infants 6.0 African American urban infants 13.6 African American urban health center infants 10.4 Racial composition African American rural infants 13.0 African American rural health center infants 7.4 0.0 2.0 4.0 6.0 8.0 10.0 12.0 14.0 Source: Politzer et al., 2001. Starfield 09/02
Primary Care and Health: Evidence-Based Summary • Countries with strong primary care • have lower overall costs • generally have healthier populations • Within countries • areas with higher primary care physician availability (but NOT specialist availability) have healthier populations • more primary care physician availability reduces the adverse effects of social inequality Starfield 09/02
Primary Care and Equity: Evidence-Based Summary In areas with low social inequity, the additional effect of primary care is small. In areas of high social inequity, the additional effect of primary care is larger. Starfield 09/02