Download

1 / 29
290 likes | 311 Views
Join interactive sessions introducing Sustainable Development's importance. Discuss factors shaping the world in 2050, the need for SD, personal contributions, and sustainable practices. Explore SD components like economy, environment, and society, aiming at lasting well-being. Highlight key areas such as resource management, societal equity, and environmental preservation for a sustainable future. Discover how current actions impact future generations and embrace a holistic approach towards SD goals.

E N D
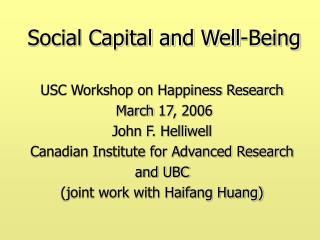
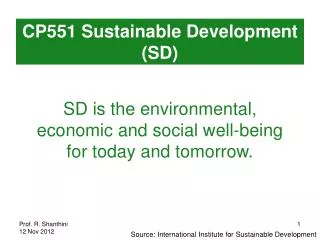
CP551 Sustainable Development (SD) SD is the environmental, economic and social well-being for today and tomorrow. Source: International Institute for Sustainable Development
Module 1: Components of SD: environment, economy & society Games and group discussions to introduce the need for Sustainable Development in today’s world
Discussion Point: How the world would be in 2050? Is there anything wrong with the way we develop today? Why we need SD? What would you like to contribute towards SD? How would you do that? Take 15 mins.
What is to be sustained? Life support Ecosystem services Resources Environment Nature Earth Biodiversity Ecosystems Community Cultures/Groups Places What is to be developed? Economy Wealth Productive sectors Consumption People Life expectancy Education Equity Equal opportunity Society Institutions Social capital States/ Regions For how long? 25 to 50 years? Now and in the future? Forever?
ECONOMICS ECOLOGY Production & Resourcing Exchange & Transfer Accounting & Regulation Consumption & Use Labour & Welfare Technology & Infrastructure Wealth & Distribution Materials & Energy Water & Air Flora & Fauna Habitat & Food Place & Space Constructions & Settlements Emission & Waste Engagement & Identity Recreation & Creativity Memory & Projection Belief & Meaning Gender & Generations Enquiry & Learning Health & Wellbeing Organization & Governance Law & Justice Communication & Movement Representation & Negotiation Security & Accord Dialogue & Reconciliation Ethics & Accountability POLITICS CULTURE
SD as defined by Brundtland Commission: “Development that meets the needs of the present without compromising the ability of future generations to meet their own needs.“ - “Our Common Future”, 1987 Dr. Gro Harlem BrundtlandFormer Prime Minister, Norway Former Chair/ World Commission on Environment and Development Responsible for the broad political concept of SD
SD as defined by Brundtland Commission: “Development that meets the needs of the present without compromising the ability of future generations to meet their own needs.“ - “Our Common Future”, 1987 It is assumed in the above definition that the state of technology and the social organizations today are unable to meet present and future needs of everyone, including the world’s poor.
Three pillars model of SD (ideal) (Social Equity) How do they relate to each other?
Discussion Point: Let us choose anything that help in the economic growth or our well being and discuss it from the point of view of the three pillars of sustainability: economic prosperity, environmental protection and social justice (equity). Take 20 mins.
Euler diagram of SD Economic Viable Equitable sustainable Environment Social Bearable
Euler diagram of SD (as we move towards SD) Economic Equitable Viable sustainable Environment Social Bearable
Euler diagram of SD (as we move towards SD) As the circles overlaps sustainability is becoming more and more realizable Economic prosperity sustainability Environmental protection Social justice
Discussion Point: Let us identify something that brings the circles of economic prosperity, environmental protection and social justice to overlap on each other. Take 20 mins.
Technocentric Ecocentric Nature should be manipulated to make humanity’s existence better Nature helps humanity’s existence and should be treated with respect and humility Present economic system is accepted, but considered to require some gradual revision Rapid and fundamental changes in economy and society are desired Sustainable development through rational use of resource, better planning and clean technologies Sustainable development through alternative and appropriate technologies
Economy Society Environment
The Egg of sustainability: ecosystem Stresses & benefits from ecosystem to people Stresses & benefits from people to ecosystem people International Union for the Conservation of Nature, 1994
Some landmarks in SD • Earth Summit — the United Nations Conference on Environment and Development in Rio de Janeiro, Brazil during 3 – 14 June 1992. • In the Earth Summit, the World committed to the following: • - Development should be sustainable. • - Eradicating poverty and reducing disparities in living standards in different parts of the world are essential to achieve sustainable development. • Guidelines to achieve the commitment:Agenda 21
Some landmarks in SD • Earth Summit — the United Nations Conference on Environment and Development in Rio de Janeiro, Brazil during 3 – 14 June 1992. • Other outcomes: • - United Nations Framework Convention on Climate Change (UNFCCC) • - Convention on Biological Diversity (CBD) • - and more…..
Some landmarks in SD United Nations Commission on Sustainable Development (CSD) established in Dec 1992 Earth Summit2002 or World Summit on Sustainable Development (WSSD) in Johannesburg, South Africa in 2002 United States did not attend it.
Some landmarks in SD Rio+20 (United Nations Conference on Sustainable Development in Rio de Janeiro, Brazil during 20-22 June 2012)
Global changes from Rio+0 to Rio+20 Shanthini, R. Did Rio+20 Assure a Sustainable Future? Economic Review, June/July 2012: 39-43
Global changes from Rio+0 to Rio+20 • global population up by 28% • global GDP per capita up by 48% • global GDP up by 89% Shanthini, R. Did Rio+20 Assure a Sustainable Future? Economic Review, June/July 2012: 39-43
Global changes from Rio+0 to Rio+20 • Range of GDP per capita of individual countries (in 2005 PPP $): • - 200 to 68,800 in 1992 • - 300 to 73,350 in 2011 • Wide gap existing between the extremities of the economic status of countries has remained persistently the same over the last twenty years. • Number of people living in slums: • - increased by 26% • - 656 million in 1990 to 827 million in 2010 Shanthini, R. Did Rio+20 Assure a Sustainable Future? Economic Review, June/July 2012: 39-43
Global changes from Rio+0 to Rio+20 CEU: Commercial Energy USE CO2: Carbon Dioxide Emission Shanthini, R. Did Rio+20 Assure a Sustainable Future? Economic Review, June/July 2012: 39-43
Global changes from Rio+0 to Rio+20 • vertebrate (comprising birds, mammals, amphibians, reptiles and fish) populations have declined by 30% since 1970 and a continuing decline is expected. • almost 20% of the vertebrate species are threatened by extinction and the levels of threat are increasing fastest for corals • number of fish species threatened has increased from 5680 in 2010 to 6213 in 2011, which is a 9% increase in a year Shanthini, R. Did Rio+20 Assure a Sustainable Future? Economic Review, June/July 2012: 39-43
Examples of nonlinear change Fisheries collapse: The Atlantic cod stocks off the east coast of Newfoundland collapsed in 1992, forcing the closure of the fishery It happened during the same year as Rio+0.
Examples of nonlinear change Fisheries collapse: For centuries local fishermen used technology that limited the volume of their catch, the area they fished, and let them target specific species and ages of fish. From the 1950s onwards, as was common in all industries at the time, new technology was introduced that allowed fishermen to trawl a larger area, fish to a deeper depth and for a longer time. By the 1960s, powerful trawlers equipped with radar, electronic navigation systems and sonar allowed crews to pursue fish with unparalleled success, and Canadian catches peaked in the late 1970s and early 1980s. http://en.wikipedia.org/wiki/Collapse_of_the_Atlantic_northwest_cod_fishery
Examples of nonlinear change • Fisheries collapse: • These new technologies adversely affected the Northern Cod population in two important ways: • by increasing the area and depth that was fished, the cod were being depleted until the surviving fish could not replenish the stock lost each year; • the trawlers caught enormous amounts of non-commercial fish, which were economically unimportant but very important ecologically: incidental catch undermines the whole ecosystem, depleting stocks of important predator and prey species. With the Northern Cod, significant amounts of capelin – an important prey species for the cod – were caught as bycatch, further undermining the survival of the remaining cod stock. http://en.wikipedia.org/wiki/Collapse_of_the_Atlantic_northwest_cod_fishery
Examples of nonlinear change Fisheries collapse: • Depleted stocks may not recover even if harvesting is significantly reduced or eliminated entirely. • In November 2006, Fisheries and Oceans Canada suggested that the slow recovery of the cod stock is due to inadequate food supplies, cooling of the North Atlantic, and a poor genetic stock due to the overfishing of larger cod. • Cod landings have continued to decline since 2009 according to Fisheries and Oceans Canada statistics through 2013. http://en.wikipedia.org/wiki/Collapse_of_the_Atlantic_northwest_cod_fishery