Download
1 / 9
150 likes | 560 Views
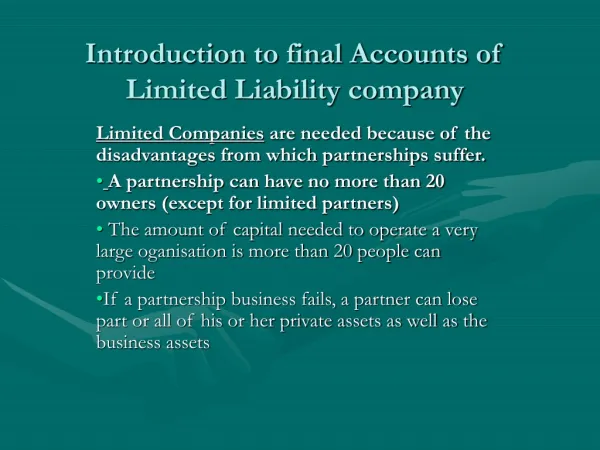
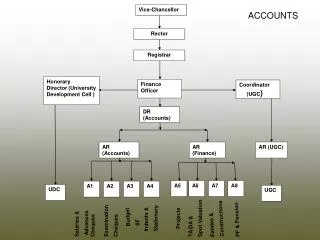
FINAL ACCOUNTS. Trading Account – shows Gross Profit. Profit and Loss Account – shows Net Profit. Balance Sheet – shows what the business owns and owes and how it has been financed. TRADING ACCOUNT. Gross Profit = Sales – Cost of Sales. 27,500. 1,000. 26,500. 9,000. 15,000. 500.

E N D
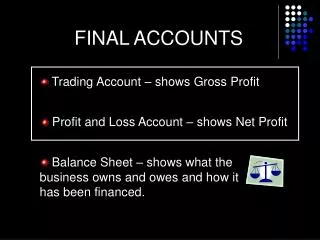
FINAL ACCOUNTS • Trading Account – shows Gross Profit • Profit and Loss Account – shows Net Profit • Balance Sheet – shows what the business owns and owes and how it has been financed.
TRADING ACCOUNT Gross Profit = Sales – Cost of Sales 27,500 1,000 26,500 9,000 15,000 500 14,500 23,500 3,750 19,750 6,750
PROFIT AND LOSS ACCOUNT Net Profit = Gross Profit - Expenses 6,750 2,000 8,750 510 125 756 159 845 545 124 400 3,464 5,286
BALANCE SHEET 80,000 13,200 8,700 101,900 80,000 5,286 970 85,286 10,050 3,750 14,866 70,420 16,520 1,750 9,000 30,000 9,000 7,520 109,420 109,420
BALANCE SHEET FIXED ASSETS Premises 80,000 Machinery 13,200 Motor Van 8,700 101,900 CURRENT ASSETS 970 Cash in hand Cash at bank 10,050 Stock 3,750 Debtors 1,750 16,520 CURRRENT LIABILITIES 9,000 Creditors 7,520 Working Capital 109,420 LONG TERM LIABILITIES 80,000 Capital + Net Profit 5,286 85,286 14,866 - Drawings 70,420 9,000 Bank Loan 30,000 Mortgage 109,420
BREAK EVEN ANALYSIS Break even is the point where: • Total costs = total income from sales • No profit has been made • No loss has been incurred • Sales above this point lead to a profit • Sales below this point lead to a loss
BREAK EVEN POINT - can be calculated using a formula TOTAL FIXED COSTS BEP = SELLING PRICE PER UNIT-VARIABLE COST PER UNIT If fixed costs = £8000, selling price per unit =£12, variable cost per unit = £4 Then 1000 units need to be sold to break even 8000 =1000 12 - 4
A break even chart can be used to show break even point Costs & Income Sales BEP Total costs Fixed costs Output/Sales
CASH FLOW • Cash flow is the flow of money into and out of the business. • Poor cash flow means there is not enough cash to meet the day to day business expenses. Cash flow forecasts help firms to anticipate problems