Download
1 / 10
100 likes | 210 Views
Straw DAQ Linux Machine: strawtrack1.fnal.gov Location: Lab 3 Machine not accessible remotely Straw Analysis Linux Machine: ppdilclaser3.fnal.gov Location: Sidet Machine is accessible remotely LOGIN from any linux machine kinit username (ie. kinit hogann)

E N D
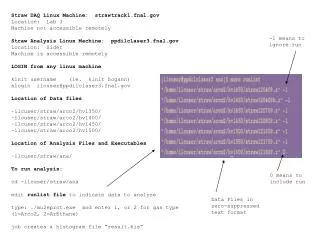
Straw DAQ Linux Machine: strawtrack1.fnal.gov Location: Lab 3 Machine not accessible remotely Straw Analysis Linux Machine: ppdilclaser3.fnal.gov Location: Sidet Machine is accessible remotely LOGIN from any linux machine kinit username (ie. kinit hogann) slogin ilcuser@ppdilclaser3.fnal.gov Location of Data files ~ilcuser/straw/arco2/hv1350/ ~ilcuser/straw/arco2/hv1400/ ~ilcuser/straw/arco2/hv1450/ ~ilcuser/straw/arco2/hv1500/ Location of Analysis Files and Executables ~ilcuser/straw/ana/ To run analysis: cd ~ilcuser/straw/ana edit runlist file to indicate data to analyze type: ./mu2eprot.exe and enter 1, or 2 for gas type (1=Arco2, 2=ArEthane) job creates a histogram file “result.his” -1 means to ignore run 0 means to include run Data Files in zero-suppressed text format
Screen Shot of Zero-Suppressed Data (All in Text Format) TDC Slot Number TDC Channel Number TDC Time (counts) Event ID To create zero-suppressed data format, for example, type: cat straw121809.out | awk -f ~ilcuser/straw/zsuppressed.awk >& straw121809.z
Mapping into LeCroy 3377 TDC channels scintillator Lab 3 Chamber (Upper Chamber) 14 12 8 8 6 4 2 0 30 28 15 13 11 9 7 5 3 1 31 29 BNL-871 chamber electronics cards PAB Chamber (Lower Chamber) 0 2 4 6 8 10 12 14 16 18 1 3 5 7 9 11 13 15 17 19 scintillator
Numbering Scheme in Analysis Lab 3 Chamber (Upper Chamber) 18 16 14 12 10 8 6 4 2 0 19 17 15 13 11 9 7 5 3 1 PAB Chamber (Lower Chamber) 38 36 34 32 30 28 26 24 22 20 39 37 35 33 31 29 27 25 23 21
Stage 2: Create histograms for track angle correction. Stage 1: Do distance-to-time (X-T) calibration • 1. Loop over all events in all • files in runlist 2. Make list of complementary pairs of hits 3. Use XT calibration histogram to convert time to distance. 3. Mark the drift “sense” of the hits. drift sense = + or - 1 4. Fill in histogram of SOD versus (drift sense)*(track angle) 5. Do simple analysis of where the inefficient hits are in the straw 6. Do simple analysis of where the noise hits are. 1. Loop over all events in all files in runlist 2. Fill histograms used for inverting the distance-to-time relationship. Only works if illumination in straw is uniform. Stage 3: Create histograms for residual in-cell correction. This correction is very small. It corrects for non-linearities in the XT calibration.
ArCO2 HV=1350 no ethanol quenching In-time Cosmic Hits Channel Number Lecroy 3377 TDC counts Lecroy 3377 TDC counts
ArCO2 HV=1400 no ethanol quenching In-time Cosmic Hits Channel Number Lecroy 3377 TDC counts Lecroy 3377 TDC counts
ArCO2 HV=1350 no ethanol quenching track near wire track near wall Gaussian resolution ~ 350 microns per hit No Corrections applied Straw Radius Units Straw Radius Units
ArCO2 HV=1400 no ethanol quenching track near wire track near wall Gaussian resolution ~ 312 microns per hit No Corrections applied Straw Radius Units Straw Radius Units