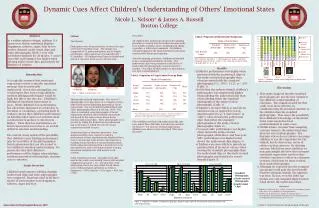
Object-Based Diagnostic Evaluation Method (MODE): Analyzing Perturbed Fake Forecasts
This study explores the Method for Object-based Diagnostic Evaluation (MODE) using test cases that include geometric and perturbed fake forecasts. Results highlight key metrics such as median intensity, percentiles, and centroid distances for matched pairs. By examining varying degrees of perturbation across multiple points, this research aims to identify optimal performance under simulated conditions. Additional insights are provided on area ratios and rainfall totals for each forecasted object, contributing to improved evaluation of forecast accuracy.

Object-Based Diagnostic Evaluation Method (MODE): Analyzing Perturbed Fake Forecasts
E N D
Presentation Transcript
Method for Object-based Diagnostic Evaluation (MODE) Fake forecasts
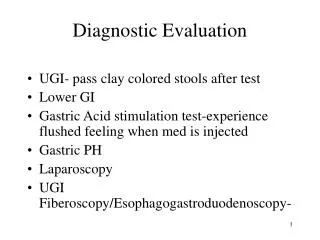
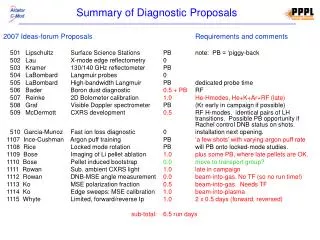
Test case results for MODE • geometric cases • mode quantity A • quantity B • perturbed fake cases • mode quantity A • quantity B • percentile of intensity • median of max • MET – mode_analysis results • centroid distance for matched pairs • percentile intensity for forecast & observed objects
1 2 3 4 5 Geometric THE WINNER THE WINNER THE WINNER
1 2 3 4 5 Geometric THE WINNER THE WINNER
1 2 3 4 5 Geometric THE WINNER
Perturbed fake cases • 3 pts right, 5 pts down • 6 pts right, 10 pts down • 12 pts right, 20 pts down • 24 pts right, 40 pts down • 48 pts right, 80 pts down • 12 pts right, 20 pts down, times 1.5 • 12 pts right, 20 pts down, minus 0.05”
would like to have… • rainfall total for each object • area ratio defined as fcst area/obs area • not just smaller area/larger area