NC-CATCH Training
NC-CATCH Training. DA. DA. D. D. D. SCHS. DA. D. D. Sheps Center. BRFSS. DA. NCHS. CLARITAS. What is NC-CATCH?. N orth C arolina C omprehensive A ssessment for T racking C ommunity H ealth. Data Warehouse Collection of Datasets Tool

NC-CATCH Training
E N D
Presentation Transcript
DA DA D D D SCHS DA D D Sheps Center BRFSS DA NCHS CLARITAS What is NC-CATCH? NorthCarolinaComprehensiveAssessmentforTracking CommunityHealth • Data Warehouse • Collection of Datasets • Tool • Compiles and analyzes county, regional, state data • Requirements • High Speed Internet • Internet Explorer • Adobe Acrobat Player
What are its benefits & limitations? • Benefits • Data available from many sources • Data easy to organize, manipulate, and present • Tailored information quick and easy • Convenient visual aids (graphs and charts) • Limitations • May need data from other sources • Not all health indicators available in design phase • Dynamic program – expect changes/upgrades
How can you use it? • Program Planning and Monitoring • Community Health Assessment • State-of-the-County’s Health Report • Grant Development • Reports to Policy Makers • Website “facts and figures” • Presentations, Articles, News Releases • Response to Public Inquiries Put a link on your desk top for quick access!
What types of data does it have?(Quantitative only, ex: Rates, Number of cases of disease, Percents) • Demographics • Per Capita Income • Unemployment • Free/Reduced Lunch • Medicaid • Uninsured • High School Dropout Rate • Mental Health • Morbidity and Mortality • Hospital Discharge • Emergency Room Visits • Behavioral Risk Factors • Health Professionals • Maternal, Infant and Child Health • Dental Services Data Sources:NC State Center for Health Statistics – BRFSS - Claritas – Cecil B. Sheps Center for Health Services Research, UNC – National Center for Health Statistics- NC DETECT Kim Angelon-Gaetz and Edna Hensey, Trainers
How does NC-CATCH differ from SCHS? NC-CATCH also has … • Years Potential Life Lost (YPLL) • Medicaid/WIC • Socioeconomic data • Emergency/hospital data • Mental health • Patient/healthcare professional ratio SCHS website also has … • High risk births • Childhood obesity • Child Health Assessment and Monitoring Program (CHAMP) • Pregnancy Risk Assessment Monitoring System (PRAMS) • Health Atlas You may have to go to other sources for additional information.
NC-CATCH Tools • County Health Profile = “Snapshot of county” • New County Health Profile - 10 major categories of important health statistics for the county organized by population, risk factor, and disease. (Available to the Public) • Old County Health Profile - 10 major categories organized by data source. (Login Required) • Drilldown Query(Login required) • Enter through Design Menu • Allows deeper analysis • Datasets organized into Cubes
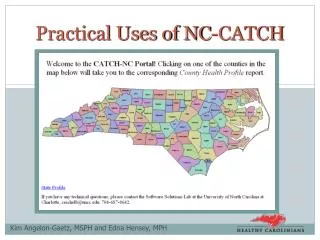
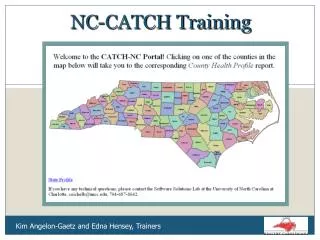
Click on the county to get the county’s health profile County Health Profile Green = Better than the state’s rate by more than 15% Yellow = Within +/- 15% of the state’s rate Red = Worse than the state’s rate by more than 15%
County Health Profile • Click on thebluelink to see all of the indicators listed under category • Click on thebluetitle of each health indicator to bring up the interactive Indicator Fact Sheet
Indicator Fact Sheet • County Name • Indicator Category and Title • Numerator and Denominator source • Description of Health Indicator • Peer List • Charts and Graphs • Link to Selected Cubes (Login) • Cancer Registry • Maternal, Infant Check out raw data for small numbers <20 events – grey shading.
Peer Counties • 3-4 Counties similar to yours (based on data from past 5 years) • % population < 18 years • % population > 64 years • % non-white population • % families with children below poverty level • Total population • Peer indicator rate = weighted average of the rates from all peer counties
Export Fact Sheets • Export to Excel • Copy graphs and charts from Excel into Word or PowerPoint Check Quick Reference for details.
County Health Profile (Old - Login Required) • Click on County to get the county health profile • Click on “Print” to getthe health indicator fact sheet Check Quick Reference for details.
Average Count Rate Incidence Prevalence Age-adjusted vs. age-specific YPLL Statistics Used in NC-CATCH
Population at Risk The total number of people in your population able to get a disease or have a health outcome. • A person is not at risk if he or she: • Dies • Has the outcome • Moves out of the population • Does not have the necessary organ or body part to get the health outcome (Ex: Males can not get cervical cancer) Large populations are in “steady-state,” assuming the same number of people entering and leaving Image from www.jsaircurtains.com
Type of Rates: Incidence Incidence Rates in the County Health Profile • Cancer morbidity rates • Infectious disease morbidity rates Incidence Rate =
Types of Rates: Prevalence Prevalence is a “snapshot” of the disease or health outcome in a population • Usually reported as a percent • A percent uses 100 as the standard unit Prevalence Rate = Example: If 10,000 residents out of 50,000 have Type 2 diabetes in my county: (10,000/50,000) *100% = 20% have Type 2 diabetes.
Types of Rates: Standardized vs. Specific • Crude rates set a standard population size • Age-adjusted rates set standard age distributions AND population sizes • Age-specific rates are rates stratified by age group Compare rates: • Use standardized rates relevant to your health outcome • Use rates for the same time period only Note: Percents are usually not age-adjusted
Check out the standard unit in the “Description” If 100: report the rate as a percent If 1,000, 10,000 or 100,000: report it as a rate Reporting Rates from NC-CATCH
Small Numbers Work with Small Numbers • Combine data into 5-year periods instead of looking at 1 year • Combine data for multiple counties or look at one region CATCH helps you easily compile data! • Rates or percents based on less than 20 eventsare considered statistically unstable. • Always check the number of events for a rate or percent!
Years Potential Life Lost (YPLL) • A measure of impact of premature death by disease • YPLL75= • NC-CATCH has both YPLL 65 and YPLL 75 (new standard)
Community Health Assessment FAQs (Frequently Asked Questions)
Example questions that can be answered in NC-CATCH • Are we meeting our county’s mental health needs? • What percent of adults (18-64) in our county are uninsured? • How does our county compare to the state in terms of our premature death rate? What are some questions you would like to explore?
Trainer’s Contact Information • Kim Angelon-Gaetz - (919) 218-0499 Kim.Angelon@dhhs.nc.gov • Edna Hensey – (919) 832-2739 Edna.Hensey@gmail.com
NC-CATCH Technical Assistance Software Solutions Lab at UNC Charlotte Email: ceichelb@uncc.edu Phone: (704) 687-8642 NC-CATCH Data Questions or Comments Kathleen Jones-Vessey, State Center for Health Statistics Email: kathleen.jones-vessey@dhhs.nc.gov Phone: (919) 715-9692 Assistance