Sample Chemical Engineering Student Team PowerPoint for Analysis
250 likes | 515 Views
Sample Chemical Engineering Student Team PowerPoint for Analysis.

Sample Chemical Engineering Student Team PowerPoint for Analysis
E N D
Presentation Transcript
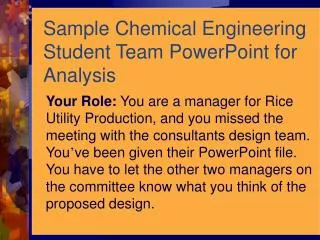
Sample Chemical Engineering Student Team PowerPoint for Analysis Your Role: You are a manager for Rice Utility Production, and you missed the meeting with the consultants design team. You’ve been given their PowerPoint file. You have to let the other two managers on the committee know what you think of the proposed design.
Sample Chemical Engineering Student Team PowerPoint for Analysis Note: Throughout, orange slides like this one will ask you questions to help you pick out things you want to remember about designing team PowerPoints. For more help or background information:Making Logical Technical Arguments PPT; Team Presentations in Chemical and Biomolecular Engineering PPT
Acetone Production Plant Design December 2, 20__ Student Team A From Ace Consultants
Project Motivation • Rice UP - acetone requirement for increased Anphal production • Maintain ROI at higher production rate
Project Goals • Increase Acetone Production by 30% • Minimize Plant Costs • Operating costs • Additional capital purchasing costs
1. Reactor and Stripping Column 1. Reactor and Stripping Column 1. Reactor and Stripping Column
In regard to the previous slide: Sample Chemical Engineering Student Team PowerPoint for Analysis What was the point of the process flow diagram you just saw? Is this the team’s recommended design? What is the team trying to tell you about their work? Are you impressed by their design so far? Why is it good? Go back for a second look. What should the heading be?
Process Specifications • 99.9% Pure Acetone • 90% Pure Hydrogen • TOC<50 ppm in Waste Water Stream
Cost Analysis • $243,000 /yr profit from given base case • ~1¢ per pound of acetone product profit margin
In regard to the previous slide: If these are the specifications, what criteria will you be looking for in the team’s design? What does the team need to show you to convince you the design will do what is needed? Did the team meet these requirements in its design solution? How do you know?
Modeling Issue • UNIFAC VLE Model does not accurately predict x-y diagram at high acetone concentrations • NRTL is best property package for acetone/water binary system • Based on DeChema VLE data
Options • 1) Use extractive distillation methods • 2) Purchase 39MM lb acetone (open market) • 3) Produce 97.6% acetone
1) Extractive Distillation • 3 Solvents • 1,2 dimethoxyethane (Diglyme) • Acetonitrile • N-Methylpyrrolidone (NMP) • Case Study: Diglyme • Prohibitive Cost • $6.765 MM /yr to purchase Diglyme • Additional Column
In regard to the previous slide: • How do you know the cost of extractive distillation Is prohibitive? • Why is the Diglyme case of interest? • Is an additional column a solution or part of the cost? • Is extractive distillation theh usual method of making acetone?
2) Purchase Acetone • Purchase 39 MM lb per year acetone for $10.92 MM • Shut down acetone production • Minimize investment losses
In regard to the previous slide: How does the team know the cost will be this much?• What has been the cost trend for acetone in the past?• How much of a “loss” will be avoided? • How do you know?
3) Produce 97.6% Acetone • Need to add 3 heat exchangers • Renegotiate deal? • Break-even point
In regard to the previous slide: What about the break-even point? What would it cost to produce acetone at this purity? Is that purity acceptable? What is this slide telling us about the option? What do these three bullet points have in common?
Recommendations • Buy acetone off open market • Dissolve acetone production facility • Recover maximum amount of lost $$
Conclusions • Adjustment of property package identified separation difficulty • Possible solutions • Extractive distillation • Purchase acetone on the open market • Renegotiate contract for lower acetone purity • Purchase acetone on open market is best
In regard to the previous slide: Why put the conclusion after the recommendation?
TAKE AWAY POINTS • After viewing this PowerPointWhat are your “take-away” lessons that you will apply to your own PowerPoint next time?
Notes This team puts its conclusions at the end and did not use informative headings on its process flow diagrams. The headings do not outline the argument. A pitch that presented the recommendation first and gave evidence of calculations to support claims would have been more persuasive. The PPT can’t reinforce the oral message or persuade readers on its own. For more help:Making Logical Technical Arguments PPT; Team Presentations in Chemical and Biomolecular Engineering PPT