Download
1 / 10
100 likes | 114 Views
Table 2.1 Monthly and annual total numbers of products issued by the RSMC Tokyo - Typhoon Center in 2011. Table 3.1 List of the tropical cyclones reaching TS intensity or higher in 2011.

E N D
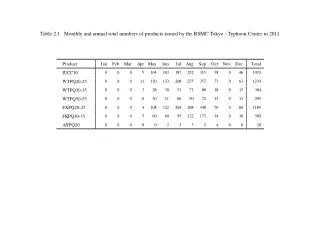
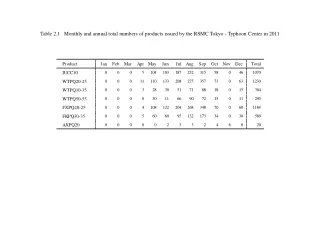
Table 2.1 Monthly and annual total numbers of products issued by the RSMC Tokyo - Typhoon Center in 2011
Table 3.1 List of the tropical cyclones reaching TS intensity or higher in 2011
Table 4.1 Mean position errors of 24-, 48-, 72-, 96- and 120-hour operational forecasts for each TC in 2011. S.D., EO, EP, and EO/EP represent the standard deviation of operational forecast position error, the operational forecast position error, the position error with the PER method, and the ratio of EO to EP respectively.
Table 4.2 Mean hitting ratios (%) and radii (km) of 70% probability circles for 24-, 48-, 72-, 96- and 120-hour operational forecasts for each TC in 2011
Table 4.3.1 Mean errors of 24-, 48- and 72-hour operational central pressure forecasts for each TC in 2011
Table 4.3.2 Mean errors of 24-, 48- and 72-hour operational maximum sustained wind forecasts for each TC in 2011
Table 4.4 Mean position errors (km) of GSM for each TC in 2011. The number of samples is given in parentheses.
Table 4.5 Table 4.5 Mean position errors (km) of GSM and PER method predictions for the 21 TCs in 2011 in the stages before, during and after recurvature. The number of samples is given in parentheses. IMPROV is error reduction rate of GSM to the PER method.
Table 4.6 Mean position errors (km) of TEPS ensemble mean forecasts for each TC in 2011. The number of samples is given in parentheses.
Table 4.7 Ensemble mean forecast position errors (km) in 2011 classified with 6-hourly accumulated ensemble spread at each forecast time. The number of samples is given in parentheses.