
Uploaded by
davida
0 SLIDES
160 VIEWS
0LIKES
Atmosphere Resources
DESCRIPTION
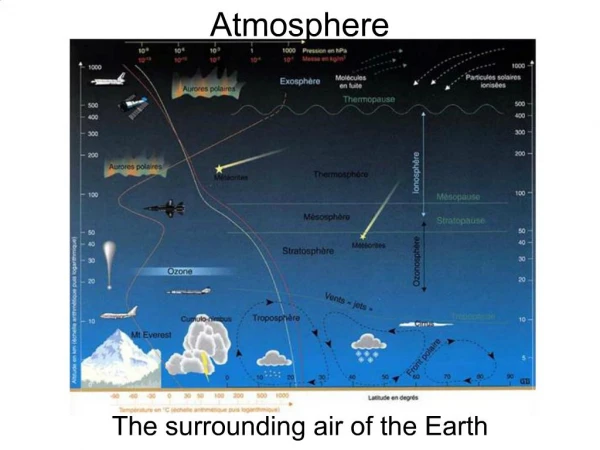
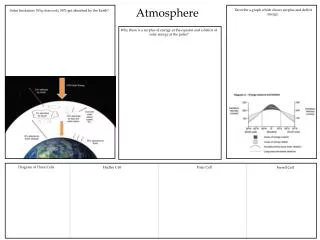
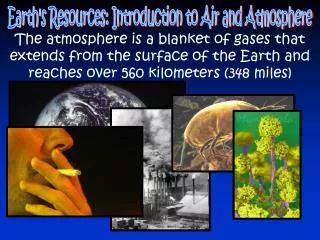
Atmosphere Resources . Chapters 17 and 18. Air Pollution. Layers of the atmosphere Pressure and Humidity Solar energy and its role in creating seasons and air circulation Role of atmosphere in creating weather and climate Cold fronts, warm fronts
Download

1 / 0
Download Presentation 
Atmosphere Resources
An Image/Link below is provided (as is) to download presentation
Download Policy: Content on the Website is provided to you AS IS for your information and personal use and may not be sold / licensed / shared on other websites without getting consent from its author.
Content is provided to you AS IS for your information and personal use only.
Download presentation by click this link.
While downloading, if for some reason you are not able to download a presentation, the publisher may have deleted the file from their server.
During download, if you can't get a presentation, the file might be deleted by the publisher.
E N D
Presentation Transcript
-
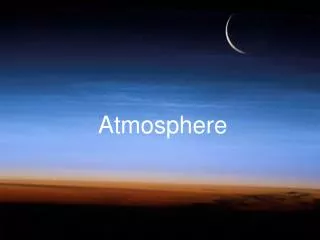
Atmosphere Resources
Chapters 17 and 18 - Air Pollution
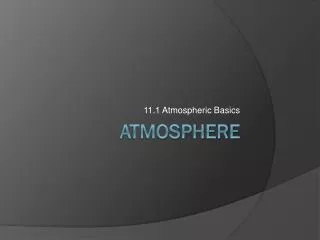
- Layers of the atmosphere Pressure and Humidity Solar energy and its role in creating seasons and air circulation Role of atmosphere in creating weather and climate Cold fronts, warm fronts High pressure systems, low pressure systems Large Scale circulation patterns (Hadley, Feral, Polar Cells) Global wind patterns Threats from storms (hurricanes, tornadoes) Review Atmosphere Basics
- Air pollution: the release of air pollutants Sources Developing Countries: wood fires, Industrialized Countries coal-burning power plants, cars, industry Outdoor (Ambient) Air Pollution is highly regulated in industrialized nations Natural Sources Volcanic eruptions: aerosols form when sulfur dioxide reacts with water and oxygen to form fine droplets, this can cool the atmosphere and surface of the planet Fires: influenced by humans, but happen naturally Winds Largest problem today (for industrialized nations) may be our release of greenhouse gasses which contribute to global climate change Examples: carbon dioxide, methane Air Pollution
- Point versus Non-point sources Primary versus Secondary Pollutants Soot, carbon monoxide Ozone, sulfuric acid Residence Time Outdoor Air Pollution
- Sketch a graph showing the residence time of the following substances: Ozone, CO, CO2, CFC’s, SO2, NO2, NO, NH3
- Air Pollution Control Act of 1955 Clean Air Act of 1963 Research funding and emissions standards for cars/stationary point sources Clean Air Act of 1970 Stricter standards, added mobile point sources, provided funds for control/research, allowed citizens to sue violators Clean Air Act of 1990 Strengthens regulations on acid deposition, ozone depletion, auto emissions, introduced emissions trading program for sulfur dioxide and other pollutants Regulated by: EPA which sets national standards for emissions and concentrations States which monitor, implement and enforce regulations Clean Air Legislation
- National Ambient Air Quality Standards (NAAQS) Carbon monoxide Colorless, odorless gas from incomplete combustion of fuel From cars (78%), combustion of waste, industrial processes, wood burning Binds to hemoglobin in RBC and prevents it from binding with oxygen Sulfur dioxide Colorless gas with a pungent odor From the combustion of coal in electric power plants (sulfur in coal reacts with oxygen to form SO2) Once in the air, it can reach to form SO3 AND H2SO4 which settles as acid deposition Nitrogen dioxide Reactive, foul smelling red/brown gas, NOX Contributes to smog and acid deposition Result when nitrogen and oxygen react in combustion engine, or combustion in industrial or electrical combustion EPA’s Criteria Pollutants
- National Ambient Air Quality Standards (NAAQS) Tropospheric ozone (ground level ozone) Not the same a ozone in the stratosphere Colorless gas with a slight odor that comes from the interaction of sunlight, heat, NOX, and volatile carbon compounds (Secondary pollutant) O3 looses an oxygen atom that can injure living tissue and cause breathing problems Most common pollutant to exceed EPA standards, must measure VOC’s Particulate matter Solids or liquids small enough to be suspended in the atmosphere Includes primary (dust, soot) and secondary (sulfates, nitrates) pollutants Can cause respiratory damage when inhaled Lead Heavy metal, particulate pollutant from gasoline additives, now banned in the United States Accumulates in the food chain (bioaccumulation) and causes problems with the central nervous system EPA’s Criteria Pollutants
- Technology and Policy go hand in hand Total emission have declined by 60% since the 1970’s Clean Air Act Despite an increase in population, energy consumption, miles traveled and GDP Carbon emission have increased 44% in that same time Technology Baghouse filters Electrostatic precipitators Scrubbers 188 toxic pollutants (cancer, reproductive, neurological, developmental, immune, respiratory problems) are also now regulated Current picture of the United States
- Scrubber Video Watch the following video and use your textbook to diagram how a scrubber works: http://www.youtube.com/watch?v=EGNa5pioGUg&feature=related (2:24)
- Industrializing nations Increasing air pollution from growing numbers of factories and power plants Little government regulation Traditional sources of fuel Rural Areas Drift from farms and industries Feedlots Methane, hydrogen sulfide, ammonia Industrializing and Rural Areas
- Our most common air quality problem is industrial smog from carbon and sulfur combustion Photochemical smog is formed when sunlight drives the chemical reactions that turn primary pollutants and normal atmospheric compounds into smog Ozone action days Reduction Vehicle emission inspection programs (34 states) Smog
- Photochemical smog Industrial smog Diagram the formation of smog
- This is what is often referred to as the “hole” in the ozone layer, it is actually a depletion of stratospheric ozone Man made halocarbons (most commonly chlorofluorocarbons or CFC’s) One free chlorine can destroy 100,000 ozone molecules Antarctic hole appears each spring Montreal Protocol addressed this problem Ozone http://ozonewatch.gsfc.nasa.gov/
- Acid or acid-forming pollutants can land on the Earth’s surface This can be from rain, fog, gases, or dry particles Is affected by the pH of the deposition and the acid-neutralizing capability of the substrate Impacts Leaching of nutrients from topsoil (calcium, magnesium, potassium) when H+ take the place of these ions and they move to the subsoil Mobilization of toxic metals (aluminum, zinc, mercury, copper) that can be taken up by plants and kill trees Acidification of waterways from runoff can lead to the death of fish Addressing the problem Scrubbers Acid Deposition
- Generally in higher concentration than outdoor air pollution 2-3 million deaths per year worldwide The average U.S. citizen spends 90% of their time indoors Sources Burning fuelwood Tobacco smoke Radon VOC’s Plastics Perfumes Carpets Copy machines New car smell Pesticides Living thins (dust, mold, fungi) Sick Building Syndrome Indoor Air Pollution
- Global Climate Change
- What is climate? What is the difference between global climate change and global warming? Factors that regulate climate (which are most important?) Sun Atmosphere Oceans Movement of planet in space Factors that warm the lower atmosphere Greenhouse gases: water, ozone, carbon dioxide, nitrous oxide, methane, halocarbons Greenhouse effect (anthropogenic intensification) Climate is dynamic
- Global Warming Potential Carbon dioxide is the greenhouse gas that we are most concerned about Why?
- Carbon dioxide (280ppm in 1700 to 389ppm in 2010) Where should most of it be? Where/why is it moving? Burning fossil fuels Clearing/burning forests (2x the harm….why?) Methane (2.5 time more now than 1700) Fossil fuels Livestock Landfills Some crops (rice) Nitrous oxide (18% more than 1750) Feedlots Chemical manufacturing Cars Fertilizers Ozone (36% more than 1750) Photochemical smog Where do our increased greenhouse gasses come from?
- Graph the change in greenhouse gasses over the last 2000 years(include CO2, CH4, N20, H20, O3)
- What is a positive feedback loop? What is a negative feedback loop? As tropospheric temperatures increase, bodies of water on Earth should increase rates of evaporation, leading to more water in the atmosphere. Is this a positive or negative feedback loop? How do aerosols and water vapor differ in their impact on temperature? Feedback loops
- Radiative Forcing: The amount of change in thermal energy that a given factor causes Positive forcing means….. Negative forcing means…… Natural rate: 342 watts/m2 Estimated change since 1750: 1.6 watts/m2 What factors influence climate? Atmospheric conditions Milankovitch Cycles Axial Wobble = Variation of Tilt Solar Output Ocean Absorption Ocean Circulation How do we measure change?
- Past: Paleoclimates Proxy indicators Ice cores Pollen grains Tree rings Pack rat middens Present Direct Measurements Thermometers, rain gauge, anemometers, barometers, computers Charles Keeling, 1958, Mauna Loa Observatory Only about a century of data Future Modeling How do we study climate change?
- Intergovernmental Panel on Climate Change (IPCC) Established in 1988 by the United Nations Environment Programme (UNEP) and the World Meteorological Organization (WMO)N Awarded the Nobel Peace Prize in 2007 for its work in informing the world of trends and impacts of climate change 2007 was the last time they released a report (their 4th Assessment Report) Major trends observed and predicted Global physical indicators Regional physical indicators Social indicators Biological indicators Who monitors what is changing
- Temperatures are rising Precipitation is changing Ice and Snow are melting (this has far reaching impacts) Sea levels are rising Coral reefs are threatened Organisms and ecosystems are affected Humans are affected Agriculture Forestry Health Economics Impacts will vary regionally This drive some of the debate between scientists What is changing?
- U.S. Global Research Program Created by congress in 1990 to coordinate federal research, reviewed in 1990 Major predictions Average rise of 2.2-6.1 degrees Celsius (4-11 F) by the end of the century Worse droughts and floods Longer growing seasons and higher CO2 levels will favor crops, but drought, heat, pests and disease will decrease most yields Snowpack decrease in West, water shortages worsen Colder weather illness decline, heat related problems will increase Tropical diseases will spread north Sea level will rise and storm surge will erode beaches and destroy wetlands and real estate Alpine ecosystems and barrier islands will begin to vanish Droughts, fire, and pets will alter forests (loss of sugar maples, some replacement of forest with grasslands and/or deserts) Melting permafrost will hinder Alaskan buildings and roads Changes in the United States
- Its all about greenhouse gasses…….. “Climategate” Are we responsible?
- Mitigation: pursue actions that reduce greenhouse gas emission to lessen the severity of climate change Energy efficiency, renewable/clean energy sources Adaptation: pursue strategies to minimize the impacts of climate change on us Flood walls in the Maldives How should we respond? 2011 Pacalaand Socolow update 2004 Pacalaand Socolow projection
- Pascala and Socolow: “When the job is too big, break it into small parts!”
- Electricity Generation Largest source of U.S. greenhouse gasses Issues of conservation and efficiency Current sources of electricity? Potential new sources? Carbon capture/sequestration Transportation 2nd largest source of U.S. greenhouse gasses Automotive technology is in place Consumer choices Other ways to reduce emissions? Agriculture Forestry waste management Where do our emissions come from?
- Kyoto Protocol 1992, U.N. Framework Convention on Climate Change (FCCC) Voluntary, nation-by-nation approach 1997, mandatory outgrowth that required signatory nations to reduce emissions to pre 1990 levels U.S. refused to sign and remains the only developed nation to not sign, they say this is because of the inequality between developed and developing nations Copenhagen Conference 2009, inteneded to be a successor to the Kyoto Protocol Never formally adopted States and Cities In the U.S. there is no federal action, so 1000 citites in all 50 states have signed the U.S. Mayors Climate Protection Agreement Policies and Regulation
- Will emission cuts hurt the economy? Can market mechanisms address climate change? Cap and Trade Emission Carbon taxes Carbon offsets and Carbon neutrality Will it just take the action of caring citizens who want to reduce their carbon footprint? Economic Questions

More Related