Download
1 / 14
140 likes | 269 Views
Tasa de homicidios. por cada cien mil habitantes. 200. 150. 100. 50. 33,23. 173,89. 183,78. 98,19. 57,30. 0. 2001. 2002. 2003. 2004. 2005. SIGUIENTE. INDICADORES DEL PD Seguridad y convivencia. SIGUIENTE. VOLVER. INDICADORES DEL PD Educación. Cupos del Régimen Subsidiado en.

E N D
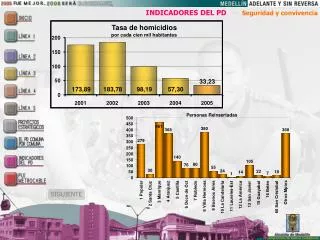
Tasa de homicidios por cada cien mil habitantes 200 150 100 50 33,23 173,89 183,78 98,19 57,30 0 2001 2002 2003 2004 2005 SIGUIENTE INDICADORES DEL PDSeguridad y convivencia
SIGUIENTE VOLVER INDICADORES DEL PDEducación
Cupos del Régimen Subsidiado en Medellín 2000-2005 1.200.000 1.000.000 800.000 413.110 600.000 239.468 237.302 223.500 224.868 400.000 1.090.631 200.000 0 2000 2001 2002 2003 2004 2005 SIGUIENTE VOLVER INDICADORES DEL PDSalud
SIGUIENTE VOLVER INDICADORES DEL PDBienestar social Personas Beneficiadas Restaurantes Escolares Personas Beneficiadas Vaso de Leche
Escuelas Populares del instructores para las EPD 260 Deporte 34 250 32 240 30 230 28 220 28 26 28 33 225 225 253 24 210 2003 2004 2005 2003 2004 2005 Niños y niñas Atendidos en Ludotekas 30 Ludotekas 8.000 25 20 6.000 15 4.000 10 2.000 4 1.116 5 25 28 6.973 7.302 0 0 2003 2004 2005 2003 2004 2005 VOLVER INDICADORES DEL PDDeporte y recreación SIGUIENTE
Toneladas de mezcla asfáltica aplicada 100.000 80.000 60.000 40.000 20.000 43.302 48.423 90.000 0 2003 2004 2005 Huecos tapados 14.000 12.000 10.000 12.000 8.000 6.000 4.009 4.000 2.160 2.000 0 2003 2004 2005 VOLVER SIGUIENTE INDICADORES DEL PDMovilidad y transporte
Metros cuadrados de parcheo elaborado 200.000 150.000 160.000 100.000 59.829 28.364 50.000 0 2003 2004 2005 Afluencia Pasajeros en el Metro 200.000.000 150.000.000 198.439.808 100.000.000 136.378.931 134.365.942 107.568.377 120.557.480 96.997.255 97.136.351 94.101.552 50.000.000 0 2000 2001 2002 2003 2004 2005 2006* 2007** SIGUIENTE VOLVER INDICADORES DEL PDMovilidad y transporte
Subsidios Nacionales Aprobados (Incluye CCF) 1.200 1.000 800 600 400 199 200 801 1.105 0 2003 2004 2005 Subsidios Municipales Aprobados 1.500 1.000 500 199 1.354 0 2003 2004 2005 VOLVER SIGUIENTE INDICADORES DEL PDVivienda
VOLVER SIGUIENTE INDICADORES DEL PD
VOLVER SIGUIENTE INDICADORES DEL PDEmpleos generados por el plan desarrollo
VOLVER SIGUIENTE INDICADORES DEL PDEmpleos generados por el plan desarrollo Empleo Generado por el Plan de Desarrollo 40.000 35.000 30.000 34.186 17.783 25.000 16.393 20.000 15.000 9.179 6.634 10.000 15.813 5.000 0 Contrataciones Empleos/año Jul 2004-Jun 2005 Jul -Dic 2005 Jul 2004 - Dic 2005
VOLVER SIGUIENTE INDICADORES DEL PDIDH 2002: 74,3
VOLVER SIGUIENTE INDICADORES DEL PDIDH 2004: 79,27
VOLVER INDICADORES DEL PDIDH 2005: 80,58