Download
1 / 23
230 likes | 246 Views
A community-based intermediary fostering economic and social well-being by offering data, analysis, and programs for neighborhoods.

E N D
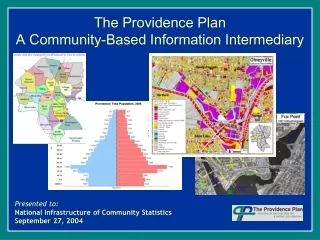
The Providence Plan A Community-Based Information Intermediary Presented to:National Infrastructure of Community Statistics September 27, 2004
Mission to promote the economic and social well-being of the city, its people, and its neighborhoods. • Private non-profit created in 1992 • Partnership of city and state government About us… “Information for Change” Agenda • Information intermediary and community convener • Investments in GIS, data analysis, and web capacity Strong programmatic capacity • Ready to Learn Providence (early care and education) • YouthBuild Providence (workforce development) • Making Connections (neighborhood revitalization)
Home and Audience The ProvPlan model works because… • We are a private non-profit • We provide independent analysis • We are not government • We are not academia In 12 years, we have learned to… • Recognize and respond to different audiences. • Invest in our GIS and Web capacity. • Design specific content and tools that appeal to different users.
NEIGHBORHOODS WARDS • Demographics • Jobs/Employment CITY • Property/Land Use CENSUS • Education POLICE POSTS • Health PARCEL • Public Safety • Quality of Life Geography and Content
Strategic Investments … Providing audiences with content at multiple geographies has required the following investments… • Construct a “data warehouse” consisting of census, administrative, and proprietary data. • Create a digital parcel layer for the city. • Promote the use of high-quality GIS and Web technologies. • Convert data from obscure geographies to neighborhoods. • Build a “master look-up table” to link addresses to parcels. • Hire and retain skilled and motivated staff.
Static • Interactive • Issue-based Different Content for Different Users • Static • Interactive • Issue-based The Providence Neighborhood Profiles • General users • Snapshot information • One dimensional • Easy to understand, easy to print • Grant writers’ best friend
Static • Interactive • Issue-based Different Content for Different Users The Providence Mill Internet Map Server • Specialized users • Detailed information (text and maps) • Available in macro and micro geographies • Parcel based • Easy to add new data layers • Real time functionality
Internet Map Server – “Interactive Content” for Advanced Users
Static • Interactive • Issue-based Different Content for Different Users Relationships with data partners • Built on a shared vision • Commitment to create a mutual benefit • Operate in trusting and collaborative spirit Examples: Education (Construction, Mobility, & Student Assignment) Public Safety (Crime Statistical Analysis) Urban Real Estate (Tax Lien Policy & Early Warning)
Old Bailey School 1998 Enrollment: 322 9 Students living within 1 mile (3%) New Bailey School 2001 Enrollment: 530 375 Students living within 1 mile (71%) Guiding School Construction
Tracking Residential Mobility Student Mobility Analysis • 20-25% of students move at least once per year • Younger children are almost twice as likely to move as children in older grades • Latino children are up to 2x more likely to move than non-Latino children
Likelihood to repeat at least 1 grade based on number of moves Students who move are two or more times more likely to repeat a grade later in school than students who do not move. Correlation of Mobility on Learning
Analyzing Student Assignment 2003-2004 Student Enrollment Data 13,581 students in 32 elementary schools Only 1% of students live more than 1-mile from any school Yet, 48% of students attend a school outside their neighborhood
How Close Can We Come to Neighborhood Schools? Data Analysis showed that… 89% of students could be placed in a neighborhood. 1,490 students could NOT BE placed. Three explanations. No neighborhood school Lack of space Education type mismatch
2 5 0 0 S t u d e n t s S t u d e n t s S t u d e n t s S t u d e n t s S t u d e n t s S t u d e n t s e n t e r i n g e n t e r i n g e n t e r i n g e n t e r i n g e n t e r i n g e n t e r i n g n t e r i n g i n 1 9 9 2 i n 1 9 9 3 i n 1 9 9 4 i n 1 9 9 5 i n 1 9 9 6 i i n 2 0 0 1 2 0 0 0 2 9 1 1 5 0 0 2 0 0 2 2 5 1 3 4 1 6 7 1 5 2 1 8 8 1 4 9 2 3 0 1 7 8 2 6 0 1 0 2 1 5 6 1 1 5 3 4 9 1 0 0 0 1 1 2 1 3 7 1 5 7 1 9 5 1 2 5 1 0 8 7 8 8 9 1 1 3 8 8 1 0 7 2 3 8 9 1 9 7 5 8 6 8 7 2 1 0 2 1 8 9 8 7 5 6 0 7 7 6 6 4 1 5 4 5 0 0 5 9 5 1 5 0 3 5 4 2 4 9 4 6 3 1 3 7 3 8 3 3 g r a d e 1 g r a d e 2 g r a d e 3 g r a d e 4 g r a d e 5 g r a d e 6 g r a d e 7 g r a d e 8 g r a d e 9 g r a d e 1 0 g r a d e 1 1 g r a d e 1 2 i n ‘ 9 0 i n ‘ 9 1 i n ‘ 9 2 i n ‘ 9 3 i n ‘ 9 4 i n ‘ 9 5 i n ‘ 9 6 i n ‘ 9 7 i n ‘ 9 8 i n ‘ 9 9 i n ‘ 0 0 i n ‘ 0 1 Mobility and the Churning Chart S t u d e n t s e S t u d e n t s S t u d e n t s S t u d e n t s S t u d e n t s e n t e r i n g e n t e r i n g e n t e r i n g e n t e r i n g n 1 9 9 7 i n 1 9 9 8 i n 1 9 9 9 i n 2 0 0 0 i n 1 9 9 1 1 9 7 7 8 6 2 3 0 7 2 4 9 1 9 1 2 4 0 4 3 0 3 4 4 S t u d e n t s 1 5 3 7 3 8 4 e n t e r i n g t h e c l a s s o f 2 0 0 2 i n 1 9 9 0 2 7 4 1 3 0 9 1 6 6 S t u d e n t s 1 1 3 4 p r o g r e s s i n g t o t h e 1 0 5 5 n e x t g r a d e 9 3 2 0 6 2 7 7 4 4 6 6 4 4 3 4 5 7 1 2 7 4 1 7 3 5 6 3 0 7 0
Violent Crime, 2002Yearly Rate Per 1000 Persons with Hot Spot MappingProvidence, RI Neighborhoods Weekly Products • Statistics • Charts • Maps Violent Crime is defined as Murder, Aggravated Assault, Robbery, and Rape. Note: Figures for Upper South Providence are inflated due to crimes being reported using RI Hospital’s address rather than place of occurrence. Rate for Downtown is inflated because of small residential population. Special Analyses • Sex offenders • Stolen vehicles • Gang posters Source: Providence Police; US Census Crime Analysis for the Police
Building Systems to Manage Urban Real Estate Develop a citywide strategy for vacant and abandoned property Designed in collaboration with city government, community development corporations (CDCs), and private developers Creation of a statewide Internet Map Server with links to commercial real estate database Tool for local city and towns, the RI Economic Development Corporation, and private developers Funders of these projects Brookings Institution Fannie Mae RI Department of Health RI Economic Development Corp. RI Foundation Annie E. Casey Foundation
2001-03 (5 sales) 1.0% 2.0% 1.2% 0.7% 2.1% 3.9% 1.8% 2.9% 2.9% 2.2% 4.6% 3.7% 5.5% 4.0% 2.0% 3.4% 7.1% 2.7% 3.7% 3.9% 8.0% Tax title properties as a percentage of all properties in neighborhood 6.2% 5.8% 6.4% Source: City of Providence Analysis: The Providence Plan 04.19.04 Examining Tax Lien Sales Policy
Parcels in theOlneyville N’hood Parcels in theOlneyville N’hood Parcels in theOlneyville N’hood Parcels in theOlneyville N’hood Parcels in theOlneyville N’hood COMPOSITE SCORE ~1,300 Parcels40% multifamily10% single family 20% vacant 15% commercial/industrial 15% other Few or no violation types Many types of violations Tickets are issued for illegal dumping and other violations related to refuse storage and handling. Mapping can also reflect crimes by type, severity, time of day, etc. Developing an Early Warning System
Lessons learned… • Home matters. • Create durable partnerships with data providers. • Build a parcel-based system. • Focus on Web-based tool and applications. • Create different uses for different audiences. Visit us at http://www.provplan.org