Download
1 / 25
250 likes | 367 Views
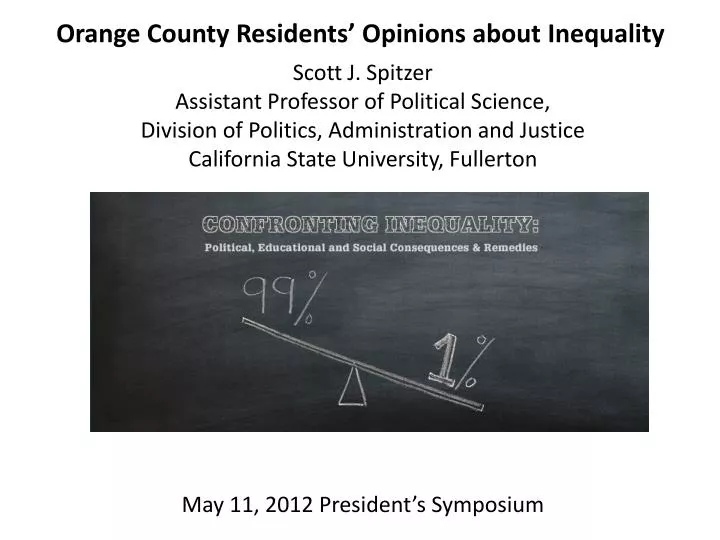
Orange County Residents’ Opinions about Inequality. Scott J. Spitzer Assistant Professor of Political Science, Division of Politics, Administration and Justice California State University, Fullerton May 11, 2012 President’s Symposium. National Opinion towards Inequality. Gallup, 2011 –

E N D
Orange County Residents’ Opinions about Inequality Scott J. Spitzer Assistant Professor of Political Science, Division of Politics, Administration and Justice California State University, Fullerton May 11, 2012 President’s Symposium
National Opinion towards Inequality • Gallup, 2011 – • How important is it that the federal government...enacts policies that attempt to do each of the following – extremely important, very important, somewhat important, or not important. How about policies designed to:
Some people think of American society as divided into two groups - the "haves" and "have-nots," while others think it's incorrect to think of America that way. Do you, yourself, think of America as divided into haves and have-nots, or don't you think of America that way?
If you had to choose, which of these groups are you in, the haves or the have-nots?
Orange County political data Total Registered voters: 1,604,299 Democrats -505,280 31% Republicans -678,064 42% other parties – 70,594 4% no preference- 350,361 22%
Thinking about the country today, how common is it for someone to start poor, work hard and become rich? Would you say it is very common, somewhat common, somewhat uncommon or very uncommon? Common Uncommon Don’t Know/ No opinion Total population46%53%1% Income $0 - $34,99944%54%2% $35 – $74,999 46%53%1% $75 - $125,00047%53%0% $125 - $199,99939%61% 0% $200,000 or more59%41%0%
Thinking about the country today, how common is it for someone to start poor, work hard and become rich? Would you say it is very common, somewhat common, somewhat uncommon or very uncommon? Common Uncommon Don’t Know Total Pop Race Caucasian or white 47% 52% 1% Black or African-American 17% 83% 0% Hispanic 42% 57% 1% Asian 47% 50% 3% Multi-ethnic or bi-racial 52% 45% 3% Partisanship Republican 56% 44% 0% Democrat 36% 64% 0% Other 50% 48% 3% No party/independent 43% 55% 2% Registered to Vote Registered 47% 53% 1% Not registered 45% 54% 1%
References Slide 2: Figure based on: Congressional Budget Office, 2011, “Trends in the Distribution of Household Income Between 1979 and 2007.” Washington, DC: GPO. Table A-1, Appendix A. Slides 3-4: Gallup Poll. December 16, 2011. “Americans Prioritize Economy over Reducing Wealth Gap.” at http://www.gallup.com/poll/151568. Accessed on May 4, 2012. Slides 5-6: Gallup Poll. December 15, 2011. “Few Americans see U.S. Divided Into ‘Haves’ and ‘Have Nots’.” Lymari Morales. At http://www.gallup.com/poll/151556. Data used from 111215 [1].pdf: “Gallup News Service, November Wave 1, Final Top Line.” Nov. 28 – Dec. 1, 2011. Slide 7: Orange County Profiles, Vol. 9, No. 3. September 2004. Center for Demographic Research; Stickley, Deborah Diep, “Orange County Progress Report: Reporting Change Over the Last 50 Years.” Map of Orange County Cities, 1954, p. 4. Slides 9-10: Figures are calculated using data from the following: U.S. Census Bureau: DP-1: Profile of General Population and Housing Characteristics: 2010, for California and Orange County.; County and City Data Book 2007, Table B-3: Counties. “Population by Age, Race, Hispanic Origin and Sex, 2000.” pp. 114-15; 160-161; and “Components of Population Change”, pp. 68-69; Orange County 2010 Census Demographic Profiles. 2010. California State University, Fullerton; County of Orange; Municipal Water District of Orange County, et al.; American Fact Finder, at: http://factfinder2.census.gov.
References - continued Slide 11 is from: Bohn, Sarah and Eric Schiff, 2011. “The Great Recession and Distribution of Income in California.” Public Policy Institute of California (PPIC). Sacramento, CA. At http://www.ppic.org. Retrieved on May 7, 2012. p. 15. Slide 12: “Statement of Registration Certification,” April 6, 2012. Orange County Registrar of Voters. Available online at: http://www.ocvote.com/datacentral. Retrieved on May 9, 2012. Slides 13-23 are compiled by the author based on the California State University, Fullerton’s Center for Public Policy, “Spring 2012 Poll of Public Opinion in Orange County”. This poll was conducted by the California State University, Fullerton Social Sciences Research Center (SSRC), from March 26th and April 30th ,2012. Details concerning this poll are below: • Telephone interviews were completed for 583 randomly selected individuals over the age of 18 residing in Orange County. Survey questions were drafted and compiled by researchers at the Center for Public Policy (CPP), and refined by the Social Science Research Center . The final survey instrument was programmed for administration utilizing computer assisted telephone interviewing (CATI) software. The survey took between ten to 59 minutes to complete, with a mean of 16.94 minutes and a median of 15 minutes. • To assure that the demographic characteristics of the survey sample reflected that of the County as a whole, two sample frames were utilized for the current study: a landline sample frame and a cell phone sample frame. A “dual frame design” was utilized in the current study whereby, people reached by cell phone who also reported having landline were interviewed as well as cell phone only respondents. In addition to being more cost effective, this design reduces the likelihood of under-representing respondents who have landlines they rarely or never answer.