Download
1 / 30
300 likes | 480 Views
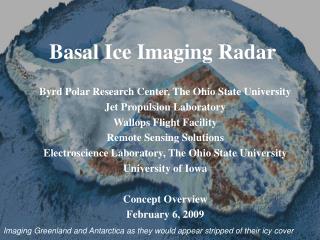
Mapping Fire Scars in Global Boreal Forests Using Imaging Radar Data. Written By: L.L. Bourgeau-Chavez, E.S. Kasischke, S. Brunzell, J.P. Mudd, and M. Tukman Reviewed By: Daniel C. Dunning. Overview.

E N D
Mapping Fire Scars in Global Boreal Forests Using Imaging Radar Data Written By: L.L. Bourgeau-Chavez, E.S. Kasischke, S. Brunzell, J.P. Mudd, and M. Tukman Reviewed By: Daniel C. Dunning
Overview • Fire scars are mappable due to ecological changes that occur post burn including increased soil moisture. • High soil moisture causes an enhanced backscatter signal to be received from burned forests. • Regional ecological differences can affect post fire changes thus impacting appearance of scars in C-band SAR imagery. • C-band European Remote Sensing Satellite (ERS) and Radarsat SAR data was used in this study to detect, map, and monitor boreal forests globally. • Study sites include four areas in Canada and an area in central Russia.
Overview Continued… • Fire boundaries were mapped from ERS SAR data without prior knowledge of fire scar locations. • Maps were validated utilizing fire service records and ground-truthing. • C-band SAR data has a high potential for detecting and mapping fire scars globally.
Review • SAR – Synthetic Aperture Radar • Uses a 1-2 meter fixed length antenna and synthesizes a much larger antenna that can be hundreds of meters in length and has improved resolving power which achieves very fine resolution from great distances. • C-band Radar – Wavelength of 5.6 cm • Experiences some surface scattering and volume scattering in the heart of a tree stand, does not reach the ground if trees are present. Also has the ability to penetrate clouds.
Introduction • Mapping and monitoring fire scars is important for resource and land management. • ERS SAR images of Alaska fire scars were 3-6 dB brighter that adjacent unburned forests. • Burned areas were determined to be detectable due to ecological changes occurring post burn. • Changes included removal of tree canopy, exposure of rough surfaces, and increased ground moisture. • Research revealed phenomenon only occurred when burned areas were wet such as early spring, early autumn, or after rain events. • The enhanced brightness allowed fire scars to be detected with moderate precision.
Introduction Continued… • Increased ground moisture is due to reduced surface albedo and the melting of the permafrost layer as well as reduced evapotranspiration. • Study was conducted using C-band SAR imagery collected over four Canadian boreal regions and an area in central Russia.
Objectives • Goal of study was to develop technique for mapping and monitoring fire-disturbed boreal forests on a global basis with the following objectives: • Determine if fire scars can be detected and mapped in varying ecological conditions using C-band SAR data; • Determine if mapping fire scars with SAR imagery alone is feasible; and • Identify any geophysical, ecological, or temporal conditions which may affect fire scar detection and area estimation in ecologically different boreal regions.
Background on Fire Mapping with SAR • Benefit of using C-band SAR for fire scar mapping is its ability to penetrate ground cover. • ERS SAR sensor is a C-band, 5.6 cm wavelength imaging radar with vertical transmit and receive polarization (C-VV). It has a resolution of 30 m and a footprint of 100 km by 100 km. ERS-1 was launched in 1991 and ERS-2 (still in operation) was launched in1995. • Radarsat launched in 1995, and is also a C-band system. It also has a resolution of 30 m and a footprint of 100 km by 100 km. • Research indicates that SAR C-band data has the potential to be used in conjunction with Landsat TM data for high accuracy fire scar mapping and monitoring. • Image on following slide indicates a before and after of a fire occurring in Alaska. Imagery indicates that both Radarsat and Landsat can be used to map burn extent, but cloud obscurity is a problem with the Landsat TM imagery.
Radarsat VS Landsat Clouds
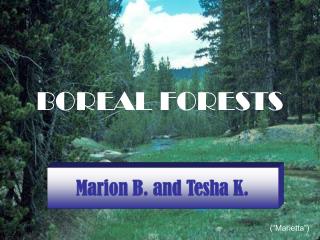
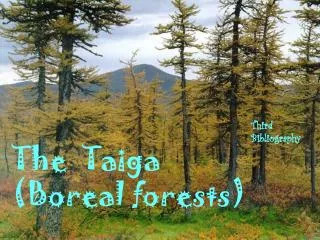
Ecology of Canada Study Areas • The North American boreal forest extends from New Foundland to Alaska with the northern limit ranging from 68° N Latitude in the Brooks Range in Alaska to 58° N Latitude at the western edge of Hudson Bay. The southern limit is less distinct and is dependant on precipitation and soil moisture. • Climate ranges from dry with extreme annual temperature variations in the west to relatively warmer, wetter, maritime climate of eastern Canada. • Fire is more frequent in the drier regions of western Canada and Alaska than in the eastern regions. Variations in fire frequency are tied to variations in climate.
Study Areas • To determine if fire scars can be detected and mapped in ecologically varying boreal ecozones of Canada three ERS study areas were chosen to capture the west to east differences. • The study areas selected were the Northwest Territories, Ontario, and Quebec. • To capture ecological variation in the north-south direction, a sequence of three to eight adjacent north-south images were obtained from each study swath.
Fire Scar Detection and Mapping in Canada • Procedure: • SAR data acquisition; • Visual evaluation and rating of data; • Selection of best rated images to be georeferenced and mosaicked; and • Digitization of potential fire scar boundaries.
Discussion and Conclusions • Fire scars are mappable in in boreal ecosystems using C-band SAR imagery. • For Ontario and NWT study sites, fire detection is feasible with SAR. For NWT, SAR data indicates more area burned than was mapped by CFS. • Data availability for Quebec was limited and analysis inconclusive. Further evaluation of SAR data collected over Quebec is necessary for any conclusions to be drawn. • Seasonal variations in fire scar visibility occur globally, with the best viewing season being either spring or autumn. • Major problem distinguishing fires form wetlands. • For boreal regions in Russia the SAR data was limited to only two years over a geographic region, and the areas were not well mapped by fire service agencies. • Manual interpretation was used for this study, but technology exists to automate the process. • An improved method for fire scar mapping and monitoring might use a combination of SAR and multi-spectral data.
Potential Applications • Fire scar mapping in deciduous forests. • Fire scar mapping in chaparral. • Fire scar mapping in grasslands. • Forest reduction in Amazon rainforests.