Epidemiology Practice
Epidemiology Practice. Epidemiology is the study of diseases in populations of humans or other animals, specifically how, when and where they occur, who they affect, and how they are contracted.


Epidemiology Practice
E N D
Presentation Transcript
Epidemiology is the study of diseases in populations of humans or other animals, specifically how, when and where they occur, who they affect, and how they are contracted. • Epidemiologists attempt to determine what factors are associated with diseases (risk factors), and what factors may protect people or animals against disease (protective factors).
Epidemiological studies can never prove causation; that is, it cannot prove that a specific risk factor actually causes the disease being studied. • Epidemiological evidence can only show that this risk factor is associated (correlated) with a higher incidence of disease in the population exposed to that risk factor. The higher the correlation the more certain the association, but it cannot prove the causation.
Epidemiologic Measures • Measures of disease frequency - measures disease risk or burden in a population • Prevalence (The Burden of Disease) • Incidence (The Risk of Disease)
Incidence Can Show Us Our Risk Example: Among 100 people, 20 develop influenza over a year. The risk is 1 in 5 (i.e. 20 among 100)
Risk Can Be Used to Illustrate Whether or Not An Association Exists Between Two Variables
Disease Yes No Total Total Exposure a + b Yes a b a + b No c d c + d c + d Total a + c b + c a + b + c + d a / (a + b) = Relative Risk c / (c + d)
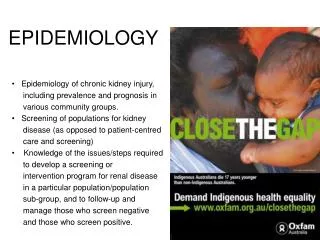
Coronary Heart Disease • Coronary heart disease (CHD) is a leading cause of death in the U.S., and the leading cause of death caused by smoking. • Smoking is hard on the heart, and the toxins in cigarette smoke cause plaques to form in the arteries, which leads to atherosclerosis, otherwise known as hardening of the arteries.
Relative Risk Develop Do Not Totals CHD Develop CHD Smokers 84 2916 3000 NonSmokers 87 4913 5000 Incidence in smokers = 84/3000 = 28.0 (per 1000) Incidence in non-smokers = 87/5000 = 17.4 ( “ ) Relative risk = 28.0/17.4 = 1.61
Interpretation of Relative Risk • RR 1 = No association between exposure and disease • incidence rates are identical between groups • RR > 1 = Positive association • exposed group has higher incidence than non-exposed group • RR < 1 = Negative association or protective effect • non-exposed group has higher incidence
Important to Remember • A relative risk of 1.0 or greater indicates an increased risk • A relative risk less than 1.0 indicates a decreased risk
Case Study #1 • An epidemiologist decides to conduct a Case Control Study by comparing people with lung cancer to people without lung cancer. She investigates the potential association of smoking to find that 45 out of 48 smokers had lung cancer, whereas 5 out of 50 non-smokers had lung cancer.
Incidence in smokers = 45/48 = 937 (per 1000) • Incidence in non-smokers = 5/50 = 100 ( “ ) • Relative risk = 937/100 = 9.37
Speed and Fatalities • There is an ongoing debate in Canada about speed limits on major highways. Advocates of higher limits need only look across the border into the United States for proof that raising speed limits is a bad idea.
A recent study examined the impact of higher travel speeds on US rural interstates after the repeal in November 1995 of the national speed limit. • Researchers found states that had increased their speed limits to 75 mph (120 km/h) experienced a shocking 38 per cent increase in deaths per million vehicle miles than expected, compared to deaths in those states that did not change their speed limits. States that increased speed limits to 70 mph (112 km/h) showed a 35 per cent increase in fatalities.
Case Study #2 • An epidemiologist decides to conduct a study of car crash fatalities as related to speed traveled. She compares the number of deaths from car crashes resulting from driving speeds ≥ 70 mph with deaths resulting from car crashes resulting from driving speed < 70 mph. • 100 people died (1,900 lived) after experiencing a car crash while traveling ≥ 70 mph. • 80 people died (7,920) lived after experiencing a car crash while traveling < 70 mph.
Do the Math! Dead Not Dead Driving Fast (≥ 70 mph) Driving Slow (< 70 mph)
Questions? • What is the Incidence of Death When Driving Fast? • What is the Incidence of Death When Driving Slow? • What is the Relative risk? • Does Speed Cause Crash Fatalities?
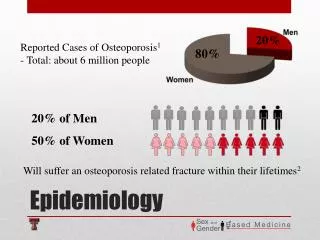
Case Study #3 • An epidemiologist decides to conduct a study of breast cancer by comparing males exposed to estrogen-containing creams in the soap and perfume industry and in men working in other areas of the factory. 5 men out of 230 exposed to estrogen contracted breast cancer compared to 1 out of 4000 with no estrogen exposure. What is the relative risk? Is there an association?
Note: • Male breast cancer is not common, accounting for approximately 1% of all breast cancers (ie, 1/100th the incidence of breast cancer in females). However, the incidence of male breast cancer has been steadily increasing since 1973 and although the reasons for this are unclear there is speculation that high estrogen levels in tap water (drinking water) may be responsible. • Currently approximately 2000 male patients per year are diagnosed.
Protective Association • RR < 1 = Negative association or protective effect • Can you think of a factor that is protective against a disease?