Download
1 / 31
310 likes | 481 Views
Strategic Planning for DSM in a Community-owned Utility. Presented by Shu-Sun Kwan & Ed Arguello Colorado Springs Utilities 2005 APPA Engineering & Operations Conference Memphis, TN April 19, 2005. Strategic Planning for DSM in a Community-owned Utility. Disclaimer

E N D
Strategic Planning for DSM in a Community-owned Utility Presented by Shu-Sun Kwan & Ed Arguello Colorado Springs Utilities 2005 APPA Engineering & Operations Conference Memphis, TN April 19, 2005
Strategic Planning for DSM in a Community-owned Utility Disclaimer The research findings and DSM strategies discussed are based upon circumstances that may be unique to Springs Utilities and may not be representative of nor applicable to other customer populations, and that personal opinions expressed are those of the presenters and are not necessarily those of Springs Utilities management or directors.
What is DSM? • DSM = Demand Side Management • Utility activities to encourage customers to modify their level and pattern of electricity usage in ways that will produce desired changes in utility’s load shape
Benefits of DSM • Utility • Contribute as an alternative resource to meet customer electricity demand • Defer future generation additions • Improve plant utilization efficiency • Customers • Provide choices to better manage energy use • Reduce electricity bills • Environment • Contribute to energy conservation • Reduce emissions and impacts to environment
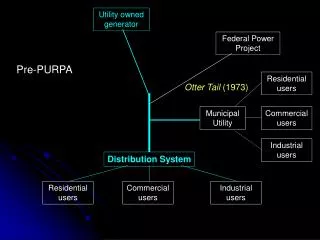
Supply Side Options Demand Side Options Existing Supply Resources Assessment Additional Supply Resources Assessment Integrated Resource Planning Electric Integrated Resource Plan Demand Forecast Public Process Policies & Limitations Integrated Resource Planning Process
Public Process Inputs (1) • Community values demonstrate the following priorities (1) Price, (2) Power Supply and (3) Environmental consideration • People generally support renewable energy and DSM but cost is a deciding factor in overall acceptance • Different opinions exist between who should pay for renewable energy and DSM programs – those that use it, or all ratepayers • Customers feel it is of equal importance to invest in renewable sources and to develop programs to help customers use less electricity (DSM) • Overall, customers favor renewable energy and DSM, but support decreases when price is added as a factor
Public Process Inputs (2) • 65% of residential customers want to include renewable energy in our supply mix, even if it costs more than other supply options • 66% of our customers feel the additional cost for renewable energy and DSM (if there was incremental cost) should be charged to all customers through utility rates • The majority (slightly more than 50%) of residential customers would be willing to pay $1 - $2 more per month to increase or double DSM programs and renewable energy sources from current levels
Scenario Grid Options General Public Preference is to Rates Low Partial General Public Preference Partial General Public Preference
Present Value of Supply Cost in Million Dollars Present Value of Supply Cost over 20 Years Recommended Strategy Reference Case Lowest Supply Cost
Levelized Supply Per Unit Cost vs. Present Value of Supply Costs Circle (●) = Current Renewable Level Triangle (▲) = Low Renewable Level X (Ж) = Medium Renewable Level Diamond (◊) = High Renewable Level Better Better Base - Current DSM & Renewables: $36.10/MWh
Market Strategies Program Options Options Screening & Prioritization Situation Analysis DSM Objectives DSM Strategies Program Design Launch Evaluation DSM Target Scenarios EIRP Process DSM Targets Benchmark Information Economic & Environmental Impact Analysis DSM Strategic Planning Process
Strategic Plan Components • Situation Analysis • DSM Objectives & Strategies • Market Strategies • Program Categories & Options • Program Screening Criteria • Economic & Environmental Modeling • DSM Target Scenarios • Measurement & Verification
Situation Analysis • High demand growth • Declining load factors • High spot market prices • Increasing natural gas prices • Community values on energy conservation
DSM Objectives • Contribute to improved system reliability of power supply • Contribute to mitigate price volatility and associated risks • Help customers use electricity more efficiently • Contribute to environmental responsibilities
DSM Strategies • Load Management • Peak clipping • Peak shifting • Valley filling • Energy Reduction • Energy efficiency • Energy conservation
Market Strategies • Detailed load research required for detailed analysis by segment • Current data indicates focus should be on the following segments • Residential • Commercial • Industrial
DSM Program Categories • Financial Incentives • Utility provides financial incentives to change behavior to use more efficient technologies and/or reduce peak load • Rates • Rate structure provides incentives or penalties to change behavior • Regulatory • Utility champions and shapes various regulatory changes to shape behavior • Market Transformation • Utility forms strategic partnerships to influence manufacturers, distributors and local business to stock EE products. • Research, Development and Demonstration • Utility champions new technologies through demonstration projects • Customer Education • Utility promotes the awareness and benefits of DSM programs • Low-IncomeProgram • Utility offers incentives to low income customers for EE installations • Utility Facility Energy Management • Utility leverage its own facilities to demonstrate the use of energy efficient systems/technologies
Program Prioritization Screening Criteria • Technical Feasibility • Costs & Cost Effectiveness • Amount of Savings (Energy & Demand) • Environmental Contribution • Ends and Executive Limitations • Level of Efforts
Economic & Environmental Modeling • Economic • It compares the benefits and costs of DSM programs • Benefits (e.g. avoided supply costs for generation, T&D, O&M and energy) • Costs (e.g. program administration costs, and participant costs) • Cost effective if benefits are greater than costs • TRC test
Economic & Environmental Modeling • Environmental • Green-house gases (CO2, CH4, etc.) • Sulfur dioxide • Nitrogen oxides • Particulates • Mercury
DSM Target Scenarios • Developed 6 Scenarios for Consideration *Modest but not trivial*Moderate *Moderate to Aggressive* Aggressive *Ramp up to “Moderate to Aggressive” in 3 years *Ramp up to “Aggressive” in 3 years • Based on National Benchmarking Data • Considers: • Energy and demand savings • Load factor improvement • Program costs • Avoided Costs • Potential Rate Impacts
Benchmarking - Energy Efficiency Program Spending Categorized by State (% of Revenue) • Range from 0% (Virginia, Kansas, N. Carolina, and Louisiana) to 2.33% (Connecticut) • National average = 0.47% • Colorado (0.14%), ranked 24 out of 51states • Springs Utilities (0.4%) * Springs Utilities numbers based on 2003 spending
Benchmarking - Energy Efficiency Program Spending Categorized by State (per Capita) • Range from $0 (Virginia, Kansas) to $19.48 per capita (Connecticut) • National average = $3.88 per capita • Colorado ($0.81), ranked 27 out of 51states • Springs Utilities ($2.5, estimated figure) * Springs Utilities numbers based on 2003 spending
Benchmarking - Energy Efficiency Program Savings (cumulative) Categorized by State (savings as % of Sales) • Range from 0% (Kansas) to 6.79% (Connecticut) • National average = 1.66% • Colorado (1.15%), ranked 23 out of 51 states • Springs Utilities (0.43%) * Springs Utilities numbers based on 2000-2003 savings and 2003 sales
Measurement & Verification • Engineering Approach • Measurement Approach • Utility Billing Data Analysis Approach
Next Steps • Implement scenario approved by Board • Reduce system energy and demand by 0.25% and 0.4% per year respectively • Conduct customer load study