
Split-Plots Designs in Process Experiments
E N D
Presentation Transcript
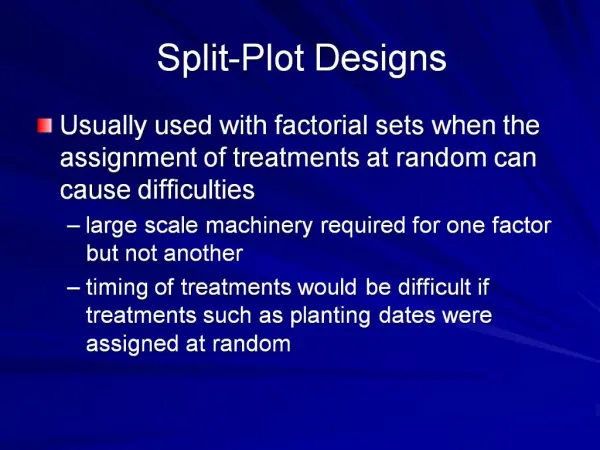
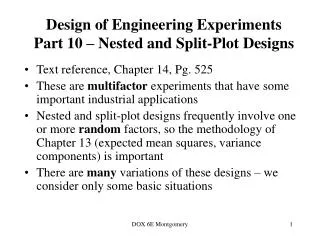
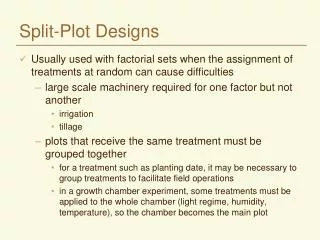
Split-Plots Designs • Used when one (or more ) factors require more experimental material for evaluation • Different size experimental units • Whole plots • Split Plots
Split Plots Common in Process Experiments • When different factors are from different process steps • When randomizing the levels of one factor is difficult or time consuming
Process Experiments • Factor in Earlier Step become Whole Plot Factor • Factors in Later Steps can be varied within and become subplot factors Process Step 1 Process Step 2 Process Step 3
Example: Cookie Baking Experiment Problem: Although made from the same recipe, except the syrup, the chocolate cookies stay thick and round after baking, but the orange cookies spread thin and flat. Orange Cookies Chocolate Cookies
Research Question: want to study factors that may affect the final diameter of the orange cookies. Factors to study: 1) Amount of shortening in cookie dough 2) Bake Temperature
1. Mix the ingredients in the dough 2. Add the orange syrup Experimental Procedure: Note: one dough batch makes enough for several trays of cookies
3. Set the oven temperature and allow the temperature to stabilize 4. Place the cookies in the oven, and set the timer. 5. Remove tray of cookies, measure diameter of each cookie and calculate the average per tray
Experimental Plan 22 Factorial Replicated Factor Run Amount of Shortening Bake Temperature Batch 1 Low Low 1 2 HighLow 2 3 Low High 3 4 High High 4 5 Low Low 5 6 High Low 6 7 Low High 7 8 High High 8 This plan requires 8 batches of Cookies
Note: one dough batch makes enough for several trays of cookies so we could test all four combinations with two batches Factor Run Amount of Shortening Bake Temperature 1 Low Low 2 Low High 3 High Low 4 High High Batch 1 Batch 2 What is the problem with this plan?
Factor Run Amount of Shortening Bake Temperature 1 Low Low 2 Low High 3 High Low 4 High High Batch 1 Batch 2 Experimental Plan 22 Factorial Its difficult to completely Randomize the order, because once I make a batch I must use it up before I can change the level of Amount of Shortening. However, I can vary the Bake Temperature from tray to tray within the batch. Any difference due to Amount of Shortening could be confused with differences in other ingredients (eggs, flour, etc. ) that change between batch 1 and batch 2
Solution: make replicate batches with the same amount of shortening Factor Run Amount of Shortening Batch 1 Low 1 2 Low 2 3 High 3 4 High 4 This is the error term for testing Amount of Shortening Fixed Effect of Amount of Shortening Random (nested) effect of Batch Now I can randomize which batches get high or low amount of shortening, and the experimental unit for amount shortening is batch .
Factor Amount of Bake Run Batch Shortening Tray Temperature 1 1 Low 1 Low 2 1 Low 2 High 3 2 High 1 Low 4 2 High 2 High 5 3 Low 1 Low 6 3 Low 2 High 7 4 High 1 Low 8 4 High 2 High I can still vary the Bake Temperature from Tray to Tray within a Batch. I can randomize the order of Bake Temperatures within each Batch What is the Experimental Unit for Bake Temperature? What is the model for the combined Plan?
Presenting Split Plot as a Cross Product Design Bake Temperature Low High Run Amount of Shortening Batch 1 Low 1 2 Low 2 3 High 3 4 High 4 y111 y112 y121 y122 y211 y212 y221 y222
Fixed Bake Temperature Effect Interaction of Amount and Temperature Fixed Amount of Shortening Effect Random (nested) effect of Batch This is called a Split Plot Model with Completely Randomized Design in the Whole Plots
Expanded Example in the Book: Factors to study: 1) Amount of shortening in cookie dough 2) Bake Temperature 3) Tray Temperature
Subplot Design 3×2 Whole Plot Design BakeT Low High Low High Low High Batch Shortening TrayT RoomT Hot RoomT Hot RoomT Hot 1 80% 1.18 1.77 1.33 2.09 1.33 1.74 2 100% 2.11 2.28 2.08 2.45 2.46 2.37 3 100% 2.01 2.14 2.07 2.26 2.19 2.34 4 80% 0.94 1.34 1.23 1.72 1.28 1.72
Hard to Vary Factors • Some factors are hard or time consuming to vary • Complete randomization is impractical
Example, John Ward (2006) Objective - study effects of factors such as: lure weight , line weight, and casting method upon distance to cast a lure with a fishing pole.
A= Lure wt. - = light + = heavy Easy to change
B = Hangs of tip of Rod - = 3 to 6 inches + = 18 to 24 inches Easy to change
C = line weight - = 6 lb + = 10 lb Hard to change
Run A B C • Light 3 to 6 10lb • Heavy 3 to 6 10lb • Light 18 to 24 10lb • Heavy 18 to 24 10lb • Light 3 to 6 6lb • Heavy 3 to 6 6lb • Light 18 to 24 6lb • Heavy 18 to 24 6lb Randomize within Randomize within Experimental Plan 23 Problem: Line wt confounded with anything that changes during experiments such as wind
More variability over longer blocks of time, thus whole plots likely to vary more than subplots
Solution Run C Block 1 10lb Johnny 2 6lb Johnny 3 10lb Matt 4 6lb Matt Randomize within This is an RCB Design
Solution • Run A B C Block • Light 3 to 6 10lb Johnny • Heavy 3 to 6 10lb Johnny • Light 18 to 24 10lb Johnny • Heavy 18 to 24 10lb Johnny • Light 3 to 6 6lb Johnny • Heavy 3 to 6 6lb Johnny • Light 18 to 24 6lb Johnny • Heavy 18 to 24 6lb Johnny • Light 3 to 6 6lb Matt • Heavy 3 to 6 6lb Matt • Light 18 to 24 6lb Matt • Heavy 18 to 24 6lb Matt • Light 3 to 6 10lb Matt • Heavy 3 to 6 10lb Matt • Light 18 to 24 10lb Matt • Heavy 18 to 24 10lb Matt Randomize within Randomize within Randomize within Randomize within What is experimental unit for A and B? What is Experimental unit for C? What is the model ?
Block Effect (random) i = 1, 2 Block by Treatment Interaction (random) Line weight crossed (fixed) j = 1,2 Lure weight (fixed) k = 1, 2 Hangs off End (fixed) l = 1, 2 This is called a Split Plot Model with Randomized Block Design in the Whole Plots
Whole Plot Split-Plot The Whole and Split-Plot Factors Have Different Experimental Units and Error Terms for F-tests
ANOVA Table for Split Plot Design with Completely Randomized Design in Whole Plots
ANOVA Table for Split Plot Design with Randomized Complete Block Design in Whole Plots