Download
1 / 46
460 likes | 655 Views
The Balance Sheet and Notes to the Financial Statements. Learning Objectives. Describe the specific elements of the balance sheet (assets, liabilities, and owners’ equity) and prepare a balance sheet with assets and liabilities properly classified into current and noncurrent categories.

E N D
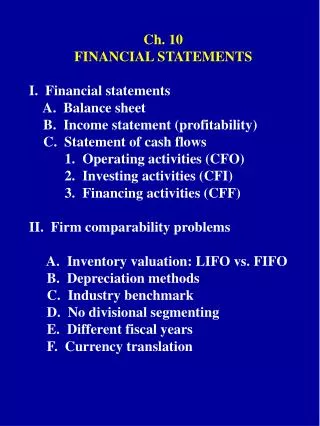
Learning Objectives • Describe the specific elements of the balance sheet (assets, liabilities, and owners’ equity) and prepare a balance sheet with assets and liabilities properly classified into current and noncurrent categories. • Identify the different formats used to present balance sheet data.
Learning Objectives • Analyze a company’s performance and financial position through the computation of financial ratios. • Recognize the importance of the notes to the financial statements, and outline the types of disclosures made in the notes. • Understand the major limitations of the balance sheet.
Usefulness of the Balance Sheet • Reports the resources (assets), obligations (liabilities), and residual ownership claims (equity) of a company. • Facilitates analysis of the company’s ability to: • meet short-term obligations (liquidity). • pay all debts as due (solvency). • Provides information about the company’s financial flexibility.
Elements of the Balance Sheet The inclusion of “probable” acknowledges that accounting is not an exact science. Assets Probable future economic benefit obtained or controlled by a particular entity as a result of past transactions or events
Elements of the Balance Sheet The primary purpose of the balance sheet is to help forecast the future. Assets Probable future economic benefit obtained or controlled by a particular entity as a result of past transactions or events
Elements of the Balance Sheet Typical assets found on a balance sheet are cash, supplies, accounts receivable, land, buildings, and equipment.
Elements of the Balance Sheet “Obligation” includes legal, moral, social, and implied commitments. Liability Probable future sacrifice of economical benefit arising from a present obligation of a particular entity to transfer assets or provide services to other entities in the future as a result of past transactions or events. Liability Probable future sacrifice of economical benefit arising from a present obligationof a particular entity to transfer assets or provide services to other entities in the future as a result of past transactions or events.
Elements of the Balance Sheet An obligation to provide services is a liability. Liability Probable future sacrifice of economical benefit arising from a present obligation of a particular entity to transfer assets or provide services to other entities in the future as a result of past transactions or events.
Elements of the Balance Sheet Typical liabilities include accounts payable, notes payable, and advances from customers.
Elements of the Balance Sheet Asset - Liability = Equity Equity Residual interest in the assets of an entity that remains after deducting its liabilities. Paid-in Capital in Excess of Par Capital Stock Retained Earnings
How to Classify Items on the Balance Sheet • Current (one year or less) • Noncurrent (more than 1 year)
Current Assets Cash and resources expected to be converted to cash during the entity’s normal operating cycle or one year, whichever is longer, are current assets. • Cash • Accounts and notes receivable • Inventories • Prepaid items
Operating Cycle Cash Collections Purchases Inventories Receivables Sales
Noncurrent Assets • Investments • Property, plant, and equipment • Deferred income taxes
Property, Plant, and Equipment Property, plant, and equipment are properties of a tangible and relatively permanent nature that are used in the normal business operations.
Intangible Assets Intangible assets are long-term rights and privileges of a nonphysical nature acquired for use in business operations.
Current Liabilities Current liabilities are obligations expected to be paid within one year or the normal operating cycle. • Accounts and notes payable • Accrued expenses • Current portion of long-term obligations • Unearned revenues
Current Liabilities If the terms of the agreement for a callable obligation is due on demand or will become due on demand within one year from the balance sheet date, the obligation should be classified as current.
Noncurrent Liabilities The current liability classification generally does not include the following items: • Debts to be liquidated from a noncurrent sinking fund. • Short-term obligations to be refinanced.
Noncurrent Liabilities • Long-term debt • Long-term lease obligations • Deferred income tax liability • Pension obligations
Noncurrent Liabilities Long-term debt is reported at its discounted present value.
Contingent Liabilities Past activities or circumstances may give rise to possible future liabilities. Potential obligations that do not exist on the balance sheet date are known as contingent liabilities.
Contingent Liabilities An estimated liability is a definite liability, so it is not a contingent liability.
Owners’ Equity Capital stock usually is the number of shares issued multiplied by the par or stated value. • Contributed Capital: • Capital stock • Additional paid-in capital
Owners’ Equity • Contributed Capital: • Capital stock • Additional paid-in capital The two types of capital stock are preferred and common.
Owners’ Equity Additional paid-in capital is the excess invested above par or stated value of the capital stock. • Contributed Capital: • Capital stock • Additional paid-in capital
Owners’ Equity Retained earnings is the amount of undistributed earnings of past periods.
Evaluating Liquidity • Current Ratio: current assets divided by current liabilities. • Quick Ratio: quick assets divided by current liabilities (Acid-Test Ratio).
Liquidity Ratios Example $200 $100 Current Assets Current Liabilities Current Ratio Cash $ 30 Net Accounts Receivable 70 Inventory 100 Current Assets $200 Current Liabilities $100 = 2:1
Liquidity Ratios Example Cash $ 30 Net Accounts Receivable 70 Inventory 100 Current Assets $200 Current Liabilities $100 $100 $100 Quick Assets Current Liabilities Cash $ 30 Net Accounts Receivable 70 Inventory 100 Current Assets $200 Current Liabilities $100 Quick Ratio = 1:1
Current Ratio Coke McDonald’s 0.5 Microsoft 2.8 Disney 1.2 Coca-Cola 0.7 Yahoo! 5.8
Overall Leverage $300 $400 Total Liabilities Total Assets Debt Ratio: total liabilities divided by total assets. Total Assets $400 Total Liabilities 300 = 75%
Debt Ratio Coke McDonald’s 52.2% Microsoft 25.6% Disney 53.1% Coca-Cola 56.1% Yahoo! 13.8%
Asset Mix $50 $400 Asset Group Total Assets The proportion of total assets in each asset category. Property, Plant, and Equipment $ 50 Total Assets 400 = 12.5%
Efficiency $200 $400 Sales Total Assets “Asset Turnover” is a financial ratio measuring how efficiently a company uses its assets to generate sales. Sales $200 Total Assets 400 = 0.50
Asset Turnover Coke McDonald’s 0.63 Microsoft 0.65 Disney 0.56 Coca-Cola 0.98 Yahoo! 0.33
Overall Profitability $40 $400 Net Income Total Assets Two ratios that measure overall profitability are “Return on Assets” and “Return on Equity.” Net Income $ 40 Total Assets 400 Stockholders’ Equity 160 Return on Assets = 10.0%
Return on Assets Coke McDonald’s 7.8% Microsoft 20.2% Disney 4.5% Coca-Cola 18.5% Yahoo! 4.1%
Overall Profitability $40 $160 Net Income Stockholders’ Equity Two ratios that measure overall profitability are “Return on Assets” and “Return on Equity.” Net Income $ 40 Total Assets 400 Stockholders’ Equity 160 Return on Equity = 0.25%
Return on Equity Coke McDonald’s 16.4% Microsoft 27.0% Disney 9.5% Coca-Cola 42.0% Yahoo! 4.8%
Notes to Financial Statements • Summary of significant accounting policies. • Additional information to support summary totals. • Information about items not included in financial statements. • Supplementary information required by the FASB or the SEC to fulfill the full-disclosure principle.
Subsequent Events Events in this period may affect the reporting of amounts in the subsequent periods Balance Sheet Date Date Statements Issued Financial Statement Period Subsequent Period
Subsequent Events Balance Sheet Date Date Statements Issued Financial Statement Period Subsequent Period • Types of Events • Those that materially affect one or more financial • statements. • Those that create a need for a footnote.
Limitations of the Balance Sheet • Does not disclose actual value of the entity. • Does not disclose effects of inflation. • Classifications are not uniform among companies. • Does not disclose all assets and liabilities.