Download
1 / 45
450 likes | 555 Views
Internet View of the Digital Divide, especially for Sub-Saharan Africa. Prepared by: Les Cottrell SLAC , Shahryar Khan NIIT/SLAC , Jared Greeno SLAC 2 nd IHY-Africa Workshop 11-16 November 2007, Addis Ababa, Ethiopia. www.slac.stanford.edu/grp/scs/net/talk07/ihy-ethiopia-nov07.ppt. Summary.

E N D
Internet View of the Digital Divide, especially for Sub-Saharan Africa Prepared by: LesCottrellSLAC, Shahryar KhanNIIT/SLAC, Jared GreenoSLAC 2nd IHY-Africa Workshop 11-16 November 2007, Addis Ababa, Ethiopia www.slac.stanford.edu/grp/scs/net/talk07/ihy-ethiopia-nov07.ppt
Summary • Why do we Measure? • Methodology of measuring Internet performance • Overall Internet performance of the world today • Africa • Performance, Routing, Difficulties • IHY & PingER • Examples of Impacts of poor performance • Conclusions & further information
Why? • In the Information Age Information Technology (IT) is the major productivity and development driver. • Travel & the Internet have made a global viewpoint critical • One Laptop Per Child ($100 computer) • New thin client paradigm, servers do work, requires networking (Google: “Negroponte $100 computer”) • Enables “Internet Kiosk” can make big difference • So we need to understand and set expectations on the accessibility, performance, costs etc. of the Internet
Methodology • Use PingER: • Arguably the world’s most extensive Active E2E Internet Monitoring project
PingER Methodology Uses ubiquitous ping >ping remhost Remote Host (typically a server) Monitoring host Internet 10 ping request packets each 30 mins Once a Day Ping response packets Data Repository @ SLAC Measure Round Trip Time & Loss
PingER Deployment • PingER project originally (1995) for measuring network performance for US, Europe and Japanese HEP community - now mainly R&E sites • Extended this century to measure Digital Divide: • Collaboration with ICTP Science Dissemination Unit http://sdu.ictp.it • ICFA/SCIC: http://icfa-scic.web.cern.ch/ICFA-SCIC/ • >150 countries (99% world’s connected population) • 40 in Africa • Monitor (40 in 14 countries) • Beacons ~ 90 • Remote sites (~700)
World Measurements: Min RTT from US • Maps show increased coverage • Min RTT indicates best possible, i.e. no queuing • >600ms probably geo-stationary satellite • Between developed regions min-RTT dominated by distance • Little improvement possible • Only a few places still using satellite for international access, mainly Africa & Central Asia 2007 2000 2006
Other World Views Data Transfer Capacity Voice & video (de-jitter) Network & Host Fragility
Thru vs Int. BW Derived thru ~ 8 * 1460 /(RTT * sqrt(loss)) Mathis et. al • Hard to get to countries (E. Africa, C Asia) • Last mile not good (China) • ’07 vs ’05 (Aus & NZ) • Emphasize Internet deploy (Estonia) • Host choice (Congo, Libya) Good Correlation
Trends:Losses • Mainly distance independent • Big impact on performance, time outs etc. • Losses > 2.5 % have big impact on interactivity, VoIP etc. • N. America, Europe, E. Asia, Oceania < 0.1% • Underdeveloped 0.3- 2% loss, Africa worst.
Jitter • ~ Distance independent • Calculated as Inter Packet Delay Variation (IPDV) • IPDV = Dri = Ri – Ri-1 • Measures congestion • Little impact on web, email • Decides length of VoIP codec buffers, impacts streaming • Impacts (with RTT and loss) the quality of VoIP Usual division into Developed vs Developing Trendlines for IPDV from SLAC to World Regions C Asia Russia S. Asia Africa SE Asia L. America M East Australasia Europe N. America E. Asia
World throughput Behind Europe 6 Yrs: Russia, Latin America 7 Yrs: Mid-East, SE Asia 10 Yrs: South Asia 11 Yrs: Cent. Asia 12 Yrs: Africa Derived throughput ~ 8 * 1460 /(RTT * sqrt(loss)) Mathis et. al South Asia, Central Asia, and Africa are in Danger of Falling Even Farther Behind
Development Classification • Many indices from ITU, UNDP, CIA, World Bank try to classify countries by their development • Difficult: what can be measured, how useful is it, how well defined, how changes with time, does it change country to country, cost of measuring, takes time to gather & often out of date, subjective • Typically use GDP, life expectancy, literacy, education, phone lines, Internet penetration etc. • E.g. HDI, DOI, DAI, NRI, TAI, OI .. In general agree with one another (R2~0.8) • Given importance of Internet in enabling development in the Information age some metrics we can measure: • International bandwidth • Number of hosts, ASNs • PingER Internet performance • See if agree with development indices. • If not may point to bad PingER data or illuminate reasons for differences • If agree quicker, cheaper to get, continuous, not as subjective
Mediterranean. & Africa vs HDI HDI related to GDP, life expectancy, tertiary education etc. • There is a good correlation between the 2 measures • N. Africa has 10 times poorer performance than Europe • N. Africa several times better than say E. Africa • E. Africa poor, limited by satellite access • W. Africa big differences, some (Senegal) can afford SAT3 fibre others use satellite • Great diversity between & within regions
Digital Opportunity Index (ITU 2006) • 180 countries, recent (data 2005, announce 2006), full coverage 2004-2005, 40 leaders have 2001-2005 • 11 indicators: • (Coverage by mobile telephony, Internet tariffs, #computers, fixed line phones, mobile subscribers, Internet users)/population • Working with ITU to see if PingER can help. • Add countries • 130>150 • Increase coverage
Correlation Loss vs DOI • Good correlation, Africa worst off
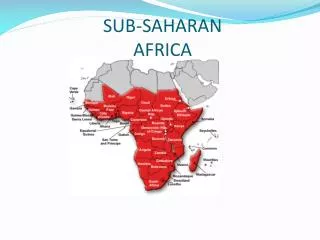
Many systemic factors:Electricity, import duties,skills, disease, protectionist policies, corruption. 915M people 14% world population, 3.6% of world internet users, mainly in cities Africa ~ 3x lower penetration than any other region huge potential market Huge growth http://www.internetworldstats.com/
Satellites vs Terrestrial • Terrestrial links via SAT3 & SEAMEW (Mediterranean, Red Sea) • Terrestrial not available to all within countries Satellite $/Mbps 300-1000x fibre costs PingER min-RTT measurements from S. African TENET monitoring station EASSy fibre for E. Africa Will it share sorry experience of SAT3 for W. Africa? Mike Jensen, Paul Hamilton TENET, S. Africa
Fibre Links Future • SAT3 connects eight countries on the W coast of the continent to Europe and the Far East. Operating as a cartel of monopoly state-owned telecommunication providers, prices have barely come down since it began operating in 2002 • SAT-3 shareholders such as Telecom Namibia, which has no landing point of its own find it cheaper to use satellite • Will EASSy follow suit? • Another option to EASSy: since Sudan and Egypt are now connected via fibre, and the link will shortly extend to Ethiopia, there are good options for both Kenya and Uganda/Rwanda and Tanzania to quickly link to the backbones via this route Mike Jensen
Divide within Divide: Africa Throughput • Overall Loss performance is poor to bad • Factor of 10 difference between Angola & Libya • N Africa best, E Africa worst 99 hosts 45 Countries • Big differences within regions • In 2002, BW/capita ranged from 0.02 to over 40bps - a factor of over 1000
Routing from S Africa • Seen from TENET Cape Town ZA • Only Botswana & Zimbabwe are direct • Most go via Europe or USA • Wastes costly international bandwidth • Need IXPs in Africa
IXPs a Major Issue for African Internet Internet B A • International bandwidth prices are biggest contributor to high costs • African users effectively subsidise international transit providers! • Fibre optic links are few and expensive reliance on satellite connectivity • High satellite latency slow speed, high prices • Growth of Internet businesses is inhibited • In 2003 10 out of 53 countries had IXPs, now 16 • More IXPs lower latency, lower costs, more usage • Both national and regional IXPs needed • Also needed: regional carriers, more fibre optic infrastructure investment IXP • Américo Muchanga americo@uem.mz, • 25 September 2005
But there are Obstacles • Current providers (cable and satellite) have a lot to loose • Many of these have close links to regulators and governments (e.g. over 50% of ISPs in Africa are government controlled) • Regulatory regimes on the whole closed and resistant to change • Sometimes ISPs themselves are unwilling to co-operate
Costs compared to West • Sites in many countries have bandwidth< US residence • “10 Meg is Here”, www.lightreading.com/document.asp?doc_id=104415 • Africa: $5460/Mbps/m • W Africa $8K/Mbps/m • N Africa $520/Mbps/m (IDRC study Jan 2005) Bandwidth Initiative: Coalition of 11 African Universities (MZ, TZ, UG, GH, NG, KY) + four major US Foundations to provide satellite thru Intelsat at 1/3 cost ($7.3K/Mbps/m => $2.23K) 1 yr of Internet access > average annual income of most Africans, Survey by Paul Budde Communications
IHY Sites & PingER Google maps • Zoom, pan etc. • IHY coordinates from Monique Petitdidier (CNRS) • SIDs from Deborah Scherrer (Stanford) • To come: Barbara Thompson (NASA) www.slac.stanford.edu/comp/net/wan-mon/viper/ihy_googlemap.htm
Conclusions • Poor performance affects data transfer, multi-media, VoIP, IT development & country performance / development • DD exists between regions, within regions, within countries, between age groups… • Decreasing use of satellites, expensive, but still needed for many remote countries in Africa and C. Asia • Last mile problems, and network fragility • International Exchange Points (IXPs) needed • Internet performance (non subjective, relatively easy/quick to measure) correlate strongly with economic/technical/development indices • Increase coverage of monitoring to understand Internet performance
More Information • Thanks: • Incentive: ICFA/SCIC, Monique Petitdidier, ICTP, ITU • Funding: SLAC/HEP, Pakistan HEC • Effort: SLAC, ICTP (Trieste), FNAL, Georgia Tech, administrators at over 40 monitoring sites • Need your help to improve African coverage • ITU/WIS Report 2006 & 2007 (or Google: “WSIS Report 2007”) • www.itu.int/osg/spu/publications/worldinformationsociety/2006/report.html • PingER • www-iepm.slac.stanford.edu/pinger, sdu.ictp.it/pinger/africa.html • Case Studies (in progress): • confluence.slac.stanford.edu/display/IEPM/South+Asia+Case+Study • confluence.slac.stanford.edu/display/IEPM/Latin+America+Case+Study • confluence.slac.stanford.edu/display/IEPM/Sub-Sahara+Case+Study • confluence.slac.stanford.edu/display/IEPM/Palestine+Case+Study
Scenario Cases 4. Sep 05, international fibre to Pakistan fails for 12 days, satellite backup can only handle 25% traffic, call centres given priority. Research & Education sites cut off from Internet for 12 days • School in a secondary town in an East Coast country with networked computer lab spends 2/3rds of its annual budget to pay for the dial-up connection. • Disconnects 2. Telecentre in a country with fairly good connectivity has no connectivity • The telecentre resorts to generating revenue from photocopies, PC training, CD Roms for content. Heloise Emdon, Acacia Southern Africa UNDP Global Meeting for ICT for Development, Ottawa 10-13 July 3. Primary health care giver, somewhere in Africa, with sonar machine, digital camera and arrangement with national academic hospital and/or international health institute to assist in diagnostics. After 10 dial-up attempts, she abandons attempts to connect
Unreachability • All pings of a set fail ≡unreachable • Shows fragility, ~ distance independent • Developed regions US, Canada, Europe, Oceania, E Asia lead • Factor of 10 improvement in 8 years • Africa, S. Asia followed by M East & L. America worst off • Africa NOT improving SE Asia L America M East C Asia Oceania S Asia SE Europe Russia Developing Regions Africa E Asia Developed Regions US & Canada Europe
Throughput • Derive from: Thru ~ 8 * 1460 _____________ (RTT * sqrt(loss))
Thru = 1460 / (RTT*sqrt(loss)) Mathis et. al Norm Thruput Norm_thru = thru * min_rtt(remote_region)/min_rtt(monitoring_region) • Note step changes • Africa v. poor • S. Asia improving • N. America, Europe, E Asia, Oceania lead
World thruput vs ITU-OI Behind Europe 6 Yrs: Russia, Latin America 7 Yrs: Mid-East, SE Asia 10 Yrs: South Asia 11 Yrs: Cent. Asia 12 Yrs: Africa South Asia, Central Asia, and Africa are in Danger of Falling Even Farther Behind
Overall (Aug 06) • ~ Sorted by Average throughput • Within region performance better (black ellipses) • Europe, N. America, E. Asia generally good • M. East, Oceania, S.E. Asia, L. America acceptable • C. Asia, S. Asia poor, Africa bad (>100 times worse) Monitored Country
VoIP & MOS • Telecom uses Mean Opinion Score (MOS) for quality • 1=bad, 2=poor, 3=fair, 4=good, 5=excellent • With VoIP codecs best can get is 4.2 to 4.4 • Typical usable range 3.5 to 4.2 • Calc. MOS from PingER: RTT, Loss, Jitter (www.nessoft.com/kb/50) MOS of Various Regions from SLAC Improvements very clear, often due to move from satellite to land line. Similar results from CERN (less coverage) Usable
Bandwidth & Internet use • Note Log scale for BW • India region leader • Pakistan leads bw/pop • Nepal very poor Bit/s • Pakistan leads % users • Sri Lanka leads hosts%% • Pakistan leads bw/pop • Nepal, Bangladesh, Afghanistan very poor
DAI vs. Thru & S. Asia • More details, also show populations • Compare S. Asia with developed countries, C. Asia
S. Asia Coverage Min-RTT from CERN • Monitor 44 hosts in region. • 6 Monitoring hosts Loss from CERN
S Asia MOS & thruput Daily throughputs from US to S Asia • weekend vs. w’day, day vs night = heavy congestion RTT NIIT to QAU Pak (1 week) RTT ms Fr Su Mo Tu Sa We Th Mean Opinion Score to S Asia from US Usable • Last mile problems • Divides into 2 • India, Maldives, Pakistan, Sri Lanka • Bangladesh, Nepal, Bhutan, Afghanistan Pakistan
Americas • Cuba poor throughput due to satellite RTTs and high losses • US & Canada lead