Download
1 / 45
450 likes | 604 Views
Issues and Approaches to Communicating Changes in Risk. Brian J. Zikmund-Fisher, PhD Center for Behavioral & Decision Sciences in Medicine (CBDSM) VA Ann Arbor Healthcare System University of Michigan Medical School. Outline. Why is communicating changes in risk so important?

E N D
Issues and Approaches to Communicating Changes in Risk Brian J. Zikmund-Fisher, PhD Center for Behavioral & Decision Sciences in Medicine (CBDSM) VA Ann Arbor Healthcare System University of Michigan Medical School
Outline • Why is communicating changes in risk so important? • A new approach: highlighting “additional” risk • Preliminary Studies
Acknowledgements • Supported by: • NIH 1 P50 CA101451 - Michigan Center for Health Communications Research (V Strecher, PI; PA Ubel, Project 3 PI) • NIH R01 CA87595 (PA Ubel, PI) • HSR&D Post-doctoral fellowship, US Dept. of Veterans’ Affairs • American Cancer Society MRSG-06-130-01-CPPB (BJ Zikmund-Fisher, PI)
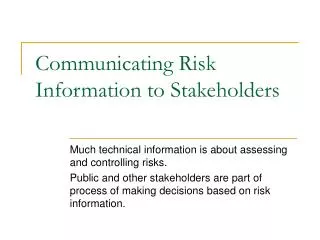
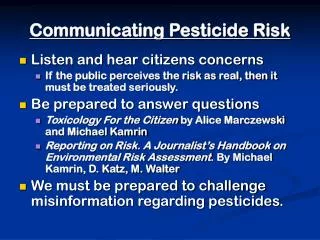
Risk Communication • The two-way exchange of information about probabilities and risk • Essential if decisions about uncertain outcomes (e.g. medical treatments) are to reflect people’s values and attitudes
Types of Risks I • Baseline risks: • “The average American woman has a 1 in 8 chance of developing breast cancer in her lifetime.” • Need to communicate a single probability • Risk is fixed, focus is on screening
Types of Risks II • Marginal risks: Risks which vary by treatment, behavior, predisposition. • E.g., “Women who took tamoxifen had a 0.6% risk of endometrial cancer, compared to 0.3% for those who did not.” • Multiple probabilities • Risk changes, so focus is on clarifying the risk-behavior relationship
Marginal Risks Are Common • Treatment outcomes & side effects • Risk factors (e.g. HTN, obesity, BRCA) • All risks which accumulate or change over time
Most Risk Communications… • Focus on single probabilities • Ignore time (or put it in a label) • When displaying change, force people to compare two total risk #’s • E.g., 15% with Pill A, 11% with placebo
Mental Arithmetic • People must add or subtract risk statistics to identify the change in risk. • Yet, change is the critical piece of info! • How much risk was caused by taking tamoxifen?
Problems with total risk graphs / tables • May not see relevance of baseline risk • Change in risk is hard to see • Mental / visual arithmetic • Size of total risk may change perceptions • I.e., if the base rate changes, perceptions may change as well
Additional Risk Concept • Clarify, and focus attention on, how much risk exists at baseline • Highlight the absolute change in risk • “1.8 additional women out of 100 would get cataracts with tamoxifen” • Minimize confusion between the totalrisk with treatment & the incrementalrisk • Note: Additional risk ≠ relative risk • NOT: “35% more risk”
Study 1: Tamoxifen • Tamoxifen has been shown to reduce the likelihood of breast cancer in women classified as having a high risk for breast cancer • High risk ≥1.66% 5 yr. risk • 50% risk reduction
Side Effects of Tamoxifen From least to most common in P-1 trial: • Endometrial cancer 0.3% => 0.6% • Cardiovascular events (stroke, blood clots etc.) • Cataracts • Menopausal symptoms 68% => 86%
Methods • Internet-administered survey • Commercially managed Internet panel • Email invitations to a demographically balanced sample of women
Design • Two main factors • Total risk versus additional risk • Text versus pictograph • Secondary factors • E.g., Probability order • Low P, high severity risks first versus last
Dependent Variable: Worry • “How worried would you be about endometrial cancer if you took tamoxifen?” • Asked for each side effect & all side effects together
Subjects • 1,789 women completed the survey • 91% completed survey if they finished 1st scenario • Mean age = 42 • 27% with Bachelor’s degree or higher (23% with High School or less) • 14% non-white and/or Hispanic
Total vs. Additional risk Worry (0-10) about endometrial cancer: Side-by-Side Additional Total RiskRisk Text 5.063.76t=6.58 p<.001 Pictographs 4.553.96t=2.85 p<.01
No Order Effects! Effect of Probability Order Low P High P FirstFirst 3.84 3.66 4.06 3.83 Total Risk (t=2.37, p<.05) (t=2.21, p<.05) Additional Risk (t=.65, n.s.) (t=.83, n.s.) Low P High P FirstFirst Text 5.40 4.72 Pictographs 4.87 4.21
ANOVA Results • Fully-factorial analysis, controlling for: • Response scale usage • Subjective numeracy • Confirmed univariate tests: • STRONG main effect of additional risk • Significant interactions of additional risk with order
Study 2: What caused this effect? • Initial study combined two changes into a single manipulation: • Additional risk framing • Sequential presentation • Baseline risk first, then post-treatment risk • Follow-up study • Consider these factors independently
Design • Internet study patterned after Study 1 • 2x2 design • Additional vs. total risk framing/language • Single graph vs. sequence of 2 graphs • Hypothetical anti-seizure drug scenario • 3 side effects: strokes, headaches, colds • Used only pictographs (1000 unit) • Included both measures of worry and perceived likelihood of side effects
Subjects • 1,393 participants drawn from same Internet panel as Study 1 • Both genders • Mean age = 49 • 34% with Bachelor’s degree or higher (18% with High School or less) • Racially stratified sample • 50% African-American • 50% Caucasian
Effect is from Additional Risk Framing Worry (0-9) about strokes: Total Additional RiskRisk Single graph 4.924.37t=2.82 p<.01 Sequential graphs 4.864.32t=2.74 p<.01 • Almost entire effect comes from framing!
Effect of Race • African-American participants… • Perceived greater risk • More worried • BUT: no interactions with additional risk or other factors
Patient Studies • Guide to Decide: Making an Informed Decision about Tamoxifen • An online decision aid to help women consider tamoxifen prophylaxis to prevent first breast cancers. • Project 3 of the Michigan Center for Health Communications Research
Guide to Decide: Goals • Test how to best present numerical information within a decision aid • Which risk messages are most effective? • Measure effectiveness of decision aids using innovative methods. • “Additional risk” included as one of 5 primary factors in Phase 1
Guide to Decide: Phase 1 Sample • 649 women from 2 HMOs • Henry Ford Health System (Detroit) • Group Health Cooperative (Seattle) • Age 40-75 • Breast cancer risk of ≥ 1.66% over next 5 years or history of lobular carcinoma in situ • Some exclusions
Guide to Decide: Focusing Risk Communications • Guide to Decide included tailored statistics on 7 risks: • 2 risk reductions • Breast cancer, bone fractures • 5 side effects • Endometrial cancer, blood clotting, cataracts, hormonal symptoms, sexual problems
Guide to Decide: Preliminary Results • Worry about tamoxifen side effects is lower with additional risk framing Total Additional RiskRisk Worry rating (1-5) 3.453.19t=3.11 p<0.01 • Similar results for other measures
Comprehension of Side Effect Risks Additional Risk 68.1% 82.8% Pct. correctly identifying that tamoxifen increases risk of endometrial cancer Total Risk Text Presentation 79.7% Pictographs 75.6%
Risk Reductions of Tamoxifen • But what about the benefits of tamoxifen? • Tamoxifen reduces the risk of… • Breast cancer • Bone fractures
The Challenge of Displaying Risk Reductions • Using the “additional risk” framework is difficult for risk reductions • Baseline risk overlaps the change in risk • Difficult to visually convey the absence of risk • Developed new approach for Guide to Decide
Comprehension of Risk Reductions Pct. correctly identifying that tamoxifen reduces breast cancer risk Total Change RiskHighlighted Text Presentation 89.8%86.2% Pictographs 84.2%79.1%
Summary • “Additional risk” framing… • Emphasizes baseline risk levels • Are more resistant to order effects • BUT, may evoke relative risk biases when comparing two risks • Additional work needed to effectively apply this concept to risk reductions