Download
1 / 56
560 likes | 736 Views
Understanding the Colorectal Cancer Burden in Kentucky: Environmental, Behavioral and Genetic Risk Factors. Presented by: Thomas C. Tucker, PhD, MPH Director Kentucky Cancer Registry Senior Director for cancer Surveillance Associate Director for Cancer Control Markey Cancer Center

E N D
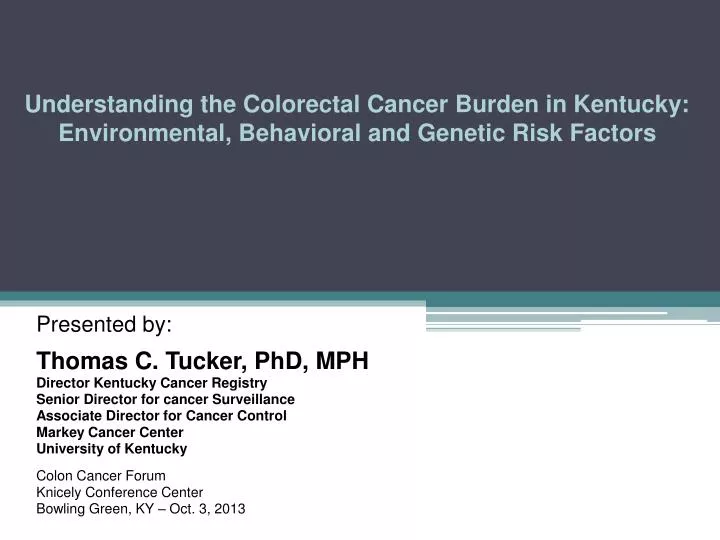
Understanding the Colorectal Cancer Burden in Kentucky:Environmental, Behavioral and Genetic Risk Factors Presented by: Thomas C. Tucker, PhD, MPH Director Kentucky Cancer Registry Senior Director for cancer Surveillance Associate Director for Cancer Control Markey Cancer Center University of Kentucky Colon Cancer Forum Knicely Conference Center Bowling Green, KY – Oct. 3, 2013
Topics to be covered • Factors that contribute to the onset of colorectal cancer. • Colorectal cancer as a % of all cancers incidence cases and deaths. • Colorectal cancer in Kentucky compared to the U.S. • Ranking states by colorectal cancer incidence and mortality rates. • Trends in Kentucky colorectal cancer incidence. • More precisely defining the colorectal cancer burden in Kentucky. • Sources of data available for defining the colorectal cancer burden. • Combining data to better describe the burden of colorectal cancer. • A model for cancer control. • An example of using colorectal cancer incidence data in combination with other data sources to focus limited resources and measure the impact of interventions.
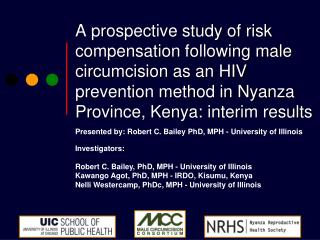
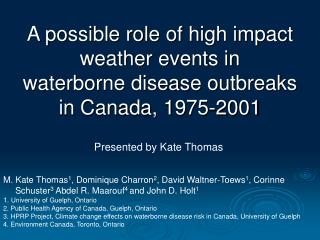
Factors Contributing to the Onset of Cancer Lifestyle Interactions Environmental Occupational Family History Genetics
Components Contributing to the Onset of Cancer Lifestyle Factors (68%) Occupational and Environmental Exposures (18%) Genetics and Family History (13%) Source: Harvard Report on Cancer Prevention, Cancer Causes & Control, Vol. 7, Supplement 1, Nov. 1996
It is important to note that the relative contribution of environmental, genetic, and behavioral factors will be different for each specific type of cancer and in each individual.It is also important to note that the interaction between environmental, genetic, and behavioral factors may significantly increase the risk of cancer.
Factors Contributing to the Onset of Cancer Lifestyle (68%) Interactions Family History Genetics (13%) Environmental Occupational (18%)
Colorectal cancer as a % of all cancers incidence cases and deaths.
Comparing colorectal cancer incidence and mortality in Kentucky to the U.S.
Colorectal Cancer Incidence Rates in the U.S. Compared to Kentucky (2005-2009) Rates per 100,000 persons and age-adjusted to the 2000 U.S. standard population
Colorectal Cancer Mortality Rates in the U.S. Compared to Kentucky (2005-2009) Rates per 100,000 persons and age-adjusted to the 2000 U.S. standard population
States ranked by colorectal cancer incidence and mortality rates.
Both Genders, Colorectal Cancer Incidence Rates Ranked by State (2005 – 2009)
Both Genders, Colorectal Cancer Mortality Rates Ranked by State (2005 – 2009)
Trends in Kentucky colorectal cancer incidence and mortality rates.
Combining Data from Multiple Sources Demographic Characteristics Contribute to Risk Factors Contribute to Incidence and Late Stage DX Contribute to Cancer Mortality Logic Model
Common sources of data that can be used for defining the cancer burden • Demographic data (Census U.S) • Risk factor data (BRFSS) • Incidence data (KCR) • Mortality data (State Vital Records)
Demographic (U.S. Census) data • Covers the entire population • Provides details on important factors that influence the burden of cancer in a population • Is only done once every 10 years in the U.S. • Is difficult to determine the number of people in a population by race and ethnicity.
CDC’s Behavioral Risk Factor Surveillance System • Largest telephone survey in the world • Tracks many important health risks • Complex sample design • Difficult to generalize the information to small populations
Incidence Data • Closer in time to causal events • Represents both occurrence and risk of getting disease • Difficult to get all of the cases • Complex coding rules • Screening effect
Mortality Data • Very complete data • Represents the ultimate negative health outcome • Far away in time from causal factors • Care must be taken to use consolidated death records
The C-Change Project Objectives • Build a separate index for the burden of lung, breast, and colorectal cancer. • Construct the index using demographic data from the U.S. Census; risk factor data from the BRFSS; and incidence, stage at diagnosis, and mortality data from the NAACCR CINA data file. • Use the index to identify the states with the highest disease burden for lung, breast, and colorectal cancer.
Methodology (Approach) • The association between the demographic, risk, incidence, stage at diagnosis and mortality variables were explored using bivariate regression models. • Variables with R-Squared values .25 or greater were used to construct the initial index for each type of cancer. • The index was created using a simple rank sum technique. States were ranked from the highest to lowest cancer burden and placed into five groups with red being the states with the highest burden of cancer and green being those states with the lowest cancer burden.
Unique KY Resources for Cancer Control Kentucky Cancer Consortium (KCC) Kentucky Cancer Program (KCP) Kentucky Cancer Registry (KCR)
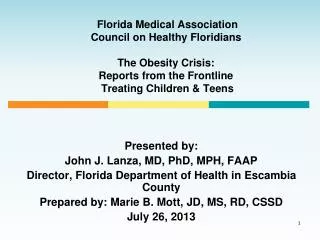
An Example In 2001, Kentucky had the highest colorectal cancer incidence rate in the U.S. compared to all of the other states
In 2001, it was also noted that Kentucky was ranked 49th in colorectal cancer screening compared to all other states with the second to the lowest rate (34.7% of the age eligible population).
Data about the burden of colorectal cancer was assembled and presented to each of the 15 District Cancer Councils. Following these presentations, all 15 of the District Cancer Councils implemented evidence-based cancer control programs aimed at increasing colorectal cancer screening for age eligible people living in their District.What happened following the implementation of these colorectal cancer screening programs?
Colorectal Cancer Screening in Kentucky 70% 63.7% 63.7% 58.6% 60% 47.2% 50% 43.9% 40% 34.7% 49th in the U.S. 20th in the U.S. 30% 1999 2002 2004 2006 2008 2010
The increase in colorectal cancer screening has been accompanied by a 22% decrease in both the incidence and mortality of colorectal cancer in Kentucky. It is important to note that these changes are statistically significant (P<.05). In other words, it is unlikely that these changes happened by random accident.
P<.05 Source: http://cancer-rates.info/ky, Accessed May, 2013