Download
1 / 1
10 likes | 123 Views
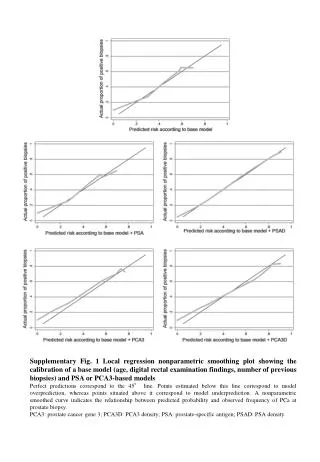
Supplementary Fig. 1 Local regression nonparametric smoothing plot showing the calibration of a base model (age, digital rectal examination findings, number of previous biopsies) and PSA or PCA3- based models

E N D
Supplementary Fig. 1 Local regression nonparametric smoothing plot showing the calibration of a base model (age, digital rectal examination findings, number of previous biopsies) and PSA or PCA3-based models Perfect predictions correspond to the 45° line. Points estimated below this line correspond to model overprediction, whereas points situated above it correspond to model underprediction. A nonparametric smoothed curve indicates the relationship between predicted probability and observed frequency of PCa at prostate biopsy. PCA3: prostate cancer gene 3; PCA3D: PCA3 density; PSA: prostate-specific antigen; PSAD: PSA density.