Download
1 / 105
1.05k likes | 1.2k Views
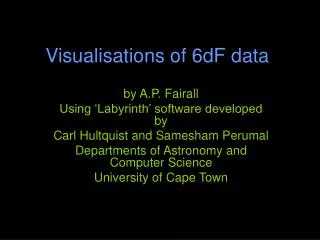
Visualisations of 6dF data. by A.P. Fairall Using ‘Labyrinth’ software developed by Carl Hultquist and Samesham Perumal Departments of Astronomy and Computer Science University of Cape Town. An introduction to Labyrinth.

E N D
Visualisations of 6dF data by A.P. Fairall Using ‘Labyrinth’ software developed by Carl Hultquist and Samesham Perumal Departments of Astronomy and Computer Science University of Cape Town
An introduction to Labyrinth This software allows one to visualise a galaxy database from any chosen position, looking in any chosen direction. One can also interactively fly around the database (although the presentation here uses still frames).
Lets start by looking at some (non-6dF) data with the galaxies Represented as white points
The readouts in the lower left corner give direction of view and position in Cartesian Supergalactic coordinates
Colour coding can be introduced to represent distance. Nearest galaxies red, distant galaxies blue
This enables a steroscopic view of the distribution using ChromoDepth™ spectacles
..we change the coding to white (near) to blue (far), which works with or without spectacles
Now we see only the nearest galaxies, which can also be shown ..
..as billboards, with images to scale, so giving a realistic visualisation of extragalactic space.
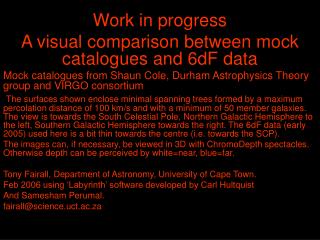
But the main purpose of Labyrinth is to grow “Tully bubbles” around groups and clusters of galaxies
The Software identifies Minimal Spanning Trees (MSTs) and wraps a surface around them. A minimum number of galaxies per MST can be specified
The MSTs are specified by a percolation radius (r) At cz = 0 To compensate for the diminishing density of data with increasing redshift, the percolation radius is increased with incresing cz. In this way the average density of bubbles stays more or less constant with increasing distance
As the bubbles grow, they interconnect to reveal the web of large-scale structures
Now to 6dF! We begin by taking 6dF data with cz < 7500 km/s so to examine very nearby large-scale structures.
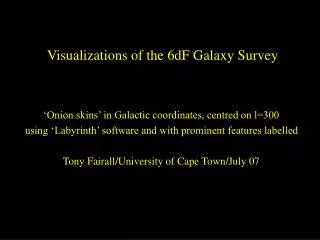
The view is looking back from a point at cz = 20000 km/s in the direction of the North Celestial Pole
Northern Galactic Hemisphere at top Southern Galactic Hemisphere at bottom
True stereoscopy can be obtained by viewing these images With ChromoDepth spectacles
As we increase the percolation distance, so the structures grow. Here it is r = 10 km/s
Much more Detail can be Seen than was Previously possible r = 80 km/s