Download
1 / 7
70 likes | 204 Views
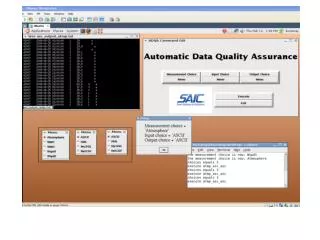
How to update the input files. Plotting capabilities. Plotting input data Plotting output data Google maps. General upper limit General seasonal limit Seasonal-upper limit Seasonal-lower limit Time Cont. general limit Time Cont, seasonal limit.

E N D
How to update the input files Plotting capabilities • Plotting input data • Plotting output data • Google maps • General upper limit • General seasonal limit • Seasonal-upper limit • Seasonal-lower limit • Time Cont. general limit • Time Cont, seasonal limit
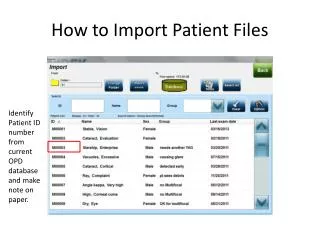
Dqa_app input_datainput_data_cfginput_limitsinput_limits_cfgoutput_dataoutput_data_cfg Quality Checked Data for Buoy 42007 6/25/08 NDBC Provided Air Temp Data Buoy 42007 6/25/08 ADQA 42007 6/25/2008 0:00:00 ATMP1 29 42007 6/25/2008 1:00:00 ATMP1 29 42007 6/25/2008 2:00:00 ATMP1 28.9 42007 6/25/2008 3:00:00 ATMP1 29 42007 6/25/2008 4:00:00 ATMP1 29.1 42007 6/25/2008 5:00:00 ATMP1 28.7 42007 6/25/2008 6:00:00 ATMP1 28.8 42007 6/25/2008 7:00:00 ATMP1 28.9 42007 6/25/2008 8:00:00 ATMP1 28.5 42007 6/25/2008 9:00:00 ATMP1 28.5 42007 6/25/2008 10:00:00 ATMP1 28.4 42007 6/25/2008 11:00:00 ATMP1 28.2 42007 6/25/2008 12:00:00 ATMP1 28.3 42007 6/25/2008 13:00:00 ATMP1 28.2 42007 6/25/2008 14:00:00 ATMP1 26.6 42007 6/25/2008 15:00:00 ATMP1 64.5 42007 6/25/2008 16:00:00 ATMP1 37.5 42007 6/25/2008 17:00:00 ATMP1 35.5 42007 6/25/2008 18:00:00 ATMP1 28.2 42007 6/25/2008 19:00:00 ATMP1 28.2 42007 6/25/2008 20:00:00 ATMP1 28.3 42007 6/25/2008 21:00:00 ATMP1 28.4 42007 6/25/2008 22:00:00 ATMP1 28.6 42007 6/25/2008 23:00:00 ATMP1 28.4 42007 6/25/2008 0:00:00 ATMP1 29 0 42007 6/25/2008 1:00:00 ATMP1 29 0 42007 6/25/2008 2:00:00 ATMP1 28.9 0 42007 6/25/2008 3:00:00 ATMP1 29 0 42007 6/25/2008 4:00:00 ATMP1 29.1 0 42007 6/25/2008 5:00:00 ATMP1 28.7 0 42007 6/25/2008 6:00:00 ATMP1 28.8 0 42007 6/25/2008 7:00:00 ATMP1 28.9 0 42007 6/25/2008 8:00:00 ATMP1 28.5 0 42007 6/25/2008 9:00:00 ATMP1 28.5 0 42007 6/25/2008 10:00:00 ATMP1 28.4 0 42007 6/25/2008 11:00:00 ATMP1 28.2 0 42007 6/25/2008 12:00:00 ATMP1 28.3 0 42007 6/25/2008 13:00:00 ATMP1 28.2 0 42007 6/25/2008 14:00:00 ATMP1 26.6 0 42007 6/25/2008 15:00:00 ATMP1 64.5 V 42007 6/25/2008 16:00:00 ATMP1 37.5 V 42007 6/25/2008 17:00:00 ATMP1 35.5 L 42007 6/25/2008 18:00:00 ATMP1 28.2 0 42007 6/25/2008 19:00:00 ATMP1 28.2 0 42007 6/25/2008 20:00:00 ATMP1 28.3 0 42007 6/25/2008 21:00:00 ATMP1 28.4 0 42007 6/25/2008 22:00:00 ATMP1 28.6 0 42007 6/25/2008 23:00:00 ATMP1 28.4 0 Range Checks (Hard & soft flags) Time Continunity Checks (Hard & soft flags) • Input/Output Configuration • File Type • Data Parameters • Data Set Dimensions Input, Output and Control Configuration Files • Control Subsystem (ie., Data Flow) • Quality Assurance Procedures
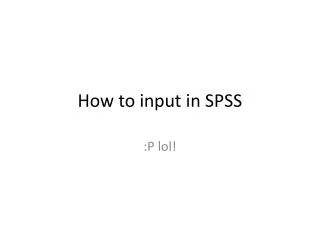
Parameter JAN FEB MAR APR MAY JUN JUL AUG SEP OCT NOV DEC BARO MAX 1029.3 1028.4 1026.7 1025.3 1022.4 1021.4 1022.2 1021.1 1020.1 1022.7 1026.2 1028.1 BARO MIN 1010.3 1007.7 1007.9 1008.2 1009.8 1010.1 1012.5 1011.1 1008.5 1008.3 1010.2 1011.0 ATMP MAX 27.9 27.9 28.5 28.9 30.0 31.3 32.1 32.1 31.5 30.6 29.3 28.1 ATMP MIN 12.7 13.2 14.6 18.1 21.6 24.3 25.5 25.5 24.6 21.2 16.9 14.4 WTMP MAX 28.2 28.1 28.3 28.5 29.4 30.6 31.5 31.8 32.7 30.5 29.5 28.7 WTMP MIN 18.5 17.8 18.3 18.0 23.1 25.8 27.2 27.6 25.5 24.9 22.2 20.3 WDIR MAX 360.0 360.0 360.0 360.0 360.0 360.0 360.0 360.0 360.0 360.0 360.0 360.0 WDIR MIN 0.0 0.0 0.0 0.0 0.0 0.0 0.0 0.0 0.0 0.0 0.0 0.0 WSPD MAX 14.5 14.2 13.9 12.6 11.3 10.3 9.4 9.8 12.8 13.4 13.6 13.8 WSPD MIN 0.0 0.0 0.0 0.0 0.0 0.0 0.0 0.0 0.0 0.0 0.0 0.0 WVHGT MX 3.0 3.0 2.9 2.5 2.2 2.0 1.7 1.8 2.7 2.7 2.7 2.8 WVHGT MN 0.0 0.0 0.0 0.0 0.0 0.0 0.0 0.0 0.0 0.0 0.0 0.0 Regional and Seasonal Limits Central Gulf of Mexico NDBC Technical Document 03-02
V L Note: L: Failed Limits Check V: Failed Time-Continunity Test
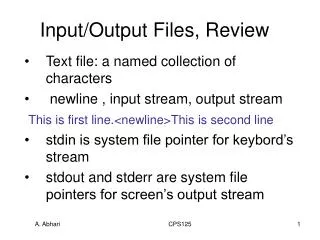
42007 Katrina August 23 to 29, 2005 “a” soft flags for observations above the Seasonal/Regional Max Limit http://visibleearth.nasa.gov/view_rec.php?id=7938 Seasonal/Regional Max Limit Storm Flag Wind Speed Seasonal/Regional Min Limit Seasonal/Regional Max Limit Seasonal/Regional Min Limit (hours)