
–70
0. ++. FeOH. –10. +++. Fe. –20. l og a Fe = −8. − 6. (aq). − 4. Hematite. –30. 2. log a O. –40. ++. Fe. –50. –60. Magnetite. FeO(c). 100°C. –70. 0. 2. 4. 6. 8. 10. 12. 14. pH. Edit → Copy As → Enhanced Metafile . Create diagrams in Act2, Tact, Gtplot ,

–70
E N D
Presentation Transcript
0 ++ FeOH –10 +++ Fe –20 • log aFe= −8 • −6 (aq) • −4 Hematite –30 2 log a O –40 ++ Fe –50 –60 Magnetite FeO(c) 100°C –70 0 2 4 6 8 10 12 14 pH
Edit → Copy As → Enhanced Metafile Create diagrams in Act2, Tact, Gtplot, or Xtplot, then copy and paste into PowerPoint as Enhanced Metafiles.
Right-click the plot, then Ungroup. Choose yes to convert image to a Microsoft Office drawing object.
Select desired line segments, edit color or style, then copy to clipboard.
Select every element, then combine into a single group.
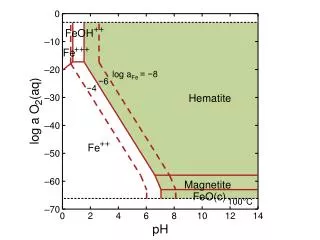
0 –10 ++ Composite activity diagram shows the effect of Fe++ activity on mineral stability fields. +++ FeOH Fe –20 (aq) log aFe = −8 • −6 • −4 Hematite –30 2 log a O –40 ++ Fe –50 –60 Magnetite FeO(c) 100°C –70 0 2 4 6 8 10 12 14 pH