Hazard Identification - Documentation
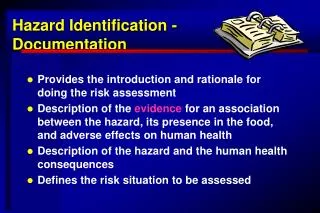
Hazard Identification - Documentation. Provides the introduction and rationale for doing the risk assessment Description of the evidence for an association between the hazard, its presence in the food, and adverse effects on human health

Hazard Identification - Documentation
E N D
Presentation Transcript
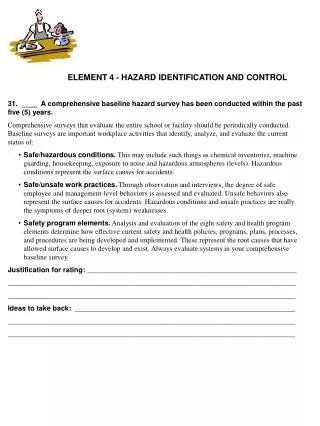
Hazard Identification - Documentation • Provides the introduction and rationale for doing the risk assessment • Description of the evidence for an association between the hazard, its presence in the food, and adverse effects on human health • Description of the hazard and the human health consequences • Defines the risk situation to be assessed
Hazard Identification • What are the microorganisms, microbial toxins or other hazards of concern in the food? • Relates to purpose & scope of assessment: • Specific hazard? • Specific food? • Commodity group? • Specific Process? • Food Handling Practices?
Typically, hazard + food risk issue already well-known and defined by manager
Hazard Identification: Information Sources • Epidemiological studies, surveillance data • Clinical trials • Laboratory animal studies • Biological research • Ecological studies throughout the food chain • Expert opinion
Exposure Assessment • Assessment of the extent of actual or anticipated human exposure • Considers extent of contamination of food, prevalence (frequency) and numbers of the organism • Typically, illness is a result of a single exposure, therefore the unit of food for assessment is a single serving of food.
Cannot measure exposure at time of consumption directly! • Therefore, must consider: • Sources, frequency & level of contamination • Factors affecting behaviour of pathogen • Distribution of food, potential for temperature abuse • Food preparation, consumption patterns
Exposure Assessment • Scope and level of detail of exposure assessment are defined by the purpose and reason for doing the assessment
Probability of Exposure PF PP PR CR CF CP Probability of Infection Production-to-Consumption RA Prevalence PREPARE & EAT RISK GROW & HARVEST PROCESS DISTRIBUTE & SELL Concentration
Production-to-Consumption “Process Risk Models” • Quantitative, ideally probabilistic • Scientific analysis of an entire system, from production to consumer • Purpose is to provide a Risk Estimate, but ALSO to identify where controls may be implemented most effectively, or where more research should be targeted • Construction of such models allow testing hypothetical “What-if” scenarios by changing model inputs
Exposure Assessment • For most microbial hazards, all require consideration of: • Survival • Growth • Inactivation
Retail/Consumer Storage: Scenarios No growth before consumption Some growth at refrigeration temperatures Growth with temperature abuse Number of organisms in one serving
Predictive Microbial Models • Mathematical expressions to describe microbial behaviour • How bacterial populations change with time, and how the rate of change influenced by environmental conditions • Primary • Secondary • Tertiary Buchanan &Whiting, 1994
Exposure Assessment: Data Sources • Published survey and experimental data • Unpublished (government, industry surveys) • Industry commodity associations • Baseline studies • Nutrition consumption studies • Expert elicitation • Other
Purpose and Scope • What are the factors in production and consumption of chicken that most significantly influence the human health risk ? • Human health risk is the “measuring stick”
Modeling Overview • Probabilistic “Process Risk Model” approach used • Systematic and logical description of the change in pathogen prevalence and concentration throughout the farm-to-fork chain
Derived from reported data Range = 40% to 80%Mean = 60% On-farm prevalence of Campylobacter in poultry - reported data
Derived from reported data Mean = 6.5 log CFU/chicken On-farm concentration of Campylobacter on poultry - reported data
Probability of Exposure PF PP PR CR CF CP Probability of Infection Production-to-Consumption RA Prevalence PREPARE & EAT RISK GROW & HARVEST PROCESS DISTRIBUTE & SELL Concentration
Process Model Overview • Processing operation is a complex system. • Simplified: 5 processing steps modeled. • Identified potentially the most important steps in poultry processing • Literature and data collected to describe changes that can be expected at various processing steps
Process Model Overview PROCESS Prevalence Concentration SCALD Hard Soft DEFEATHER EVISCERATE WASH CHILL w free Cl2 w/o free Cl2
Probability of Exposure PF PP PR CR CF CP Probability of Infection Production-to-Consumption RA Prevalence PREPARE & EAT RISK GROW & HARVEST PROCESS DISTRIBUTE & SELL Concentration
Risk Model for C. jejuni on Poultry - Summary Concentration on Contaminated Chickens Prevalence of Contaminated Chickens Risk to Population from Chicken Storage Die Off Proportion of Population Undercooking Proportion surviving cooking Dose Response Risk to Population Undercooking Contaminated Chicken Risk to Population from Contaminated Chicken
Risk Management Goals (CCFH) • To provide scientific advice to FAO and WHO Member Countries and Codex on the risk assessment of Salmonella in broiler chicken and in eggs • To use risk assessment information in developing guidelines and standards
Risk assessment • Develop risk assessment frameworks that could be adopted & modified as needed by individual countries • Develop a resource document of current information and identify data gaps
Scope • Ideally, to describe the “farm-to-fork” pathway for these pathogen/food combinations and the risk of human illness • Evaluate risk reductions by different management strategies
Exposure Assessment: Salmonella spp. in Broiler Chicken • Salmonella spp. in broiler chicken meat: • No complete “farm-to-fork” assessments existed prior to this work • Many quantitative data limitations for farm and during processing
Salmonella in Broiler Chicken Production Processing P - prevalence N - concentration N P Retail & storage N P Preparation Consumption N P Estimate of exposure
GROWTH Exit From Process RETAIL STORAGE TRANSPORT TO HOME STORAGE AT HOME COOKING PREPARATION CROSS CONTAMINATION CONSUMPTION DOSE RISK (CONSUMPTION) RISK (CROSS-CONTAM) Exposure AssessmentSalmonella spp. in Broiler Chicken
Risk Assessment forSalmonella Enteritidis in Eggs Joint FAO/WHO Initiative on Microbial Risk Assessment
Model stages for SEexposure assessment Shell Eggs Processing Distribution Storage On-farm Production Preparation Consumption Egg Products Processing
Prevalence Concentration X Data types for exposure assessment X X X X X X X X X X X X X X X X
Risk Assessment of the Relative Risk to Public Health from Foodborne Listeria monocytogenes among Selected Categories of Ready-to-Eat FoodsFDA/USDA/CDC 2004
Scope FDA/USDA/CDC • To predict the comparative risk among ready-to-eat foods that have a history of either Listeria monocytogenes (LM) contamination or implicated epidemiologically.
Observations • Outbreaks of listeriosis frequently represent a breakdown in the food safety controls already established • Growth AFTER processing is important for this pathogen • Risk modeling begins with data about the food category after processing.
Exposure estimates FDA/USDA/CDC • Described quantitatively and qualitatively (ranked high, medium, low): • Number of servings per year • Amount of food eaten (one serving size) • Contamination frequency • Predicted levels of LM in RTE food • Growth rate during storage • Most likely storage time
Factors influencing death, growth rate, and how much growth of LM • Time • Temperature • Product composition • salt/aw • pH • organic acids • other inhibitors, e.g. phenolics from smoke • Other bacteria (may inhibit,or promote growth
Results • Ranked 20 food categories for risk posed to 3 groups of people: • healthy • elderly • newborn babies (infection in mother) • Ready-to-eat seafoods, produce, dairy, meats, and salads • Identified data gaps http://www.foodsafety.gov/~dms/lmrisk
Exposure Assessment • Systematic evaluation of available data: • Identify sources of variability • Identify sources of uncertainty • Helps understand the food production system • Risk assessment models should be considered “dynamic” and as frameworks for adaptation and improvement • Country/region specific data can be used as inputs • Improved data will improve risk estimates • Better understanding of production-to-consumer pathway will improve modeling