Download
1 / 17
170 likes | 381 Views
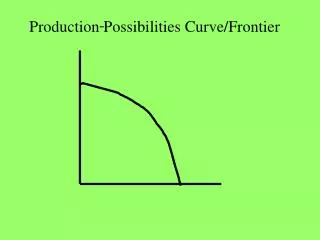
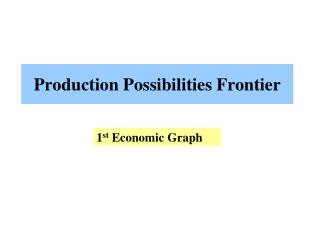
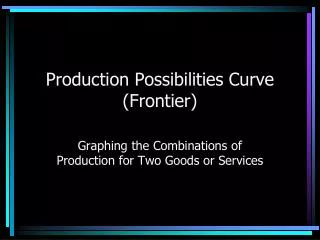
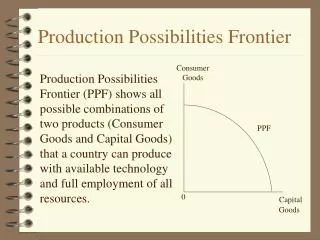
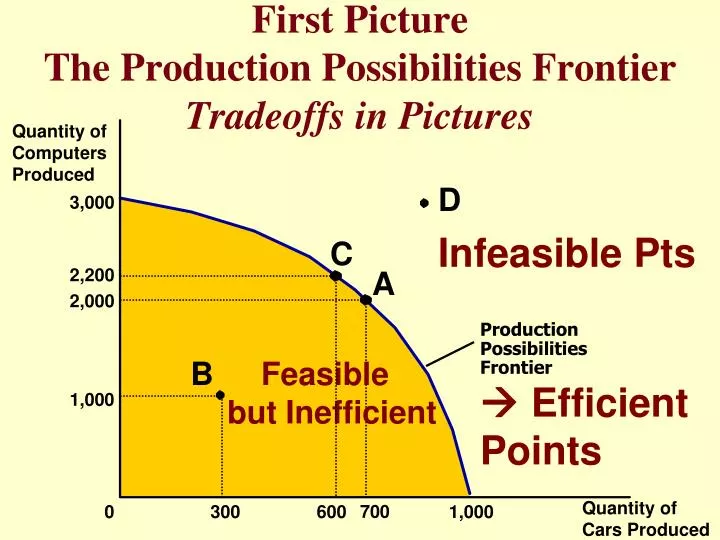
First Picture The Production Possibilities Frontier Tradeoffs in Pictures. Quantity of Computers Produced. D Infeasible Pts. 3,000. C. 2,200. A. 2,000. Production. Possibilities. B Feasible but Inefficient. Frontier Efficient Points. 1,000. Quantity of Cars Produced.

E N D
First PictureThe Production Possibilities FrontierTradeoffs in Pictures Quantity of Computers Produced D Infeasible Pts 3,000 C 2,200 A 2,000 Production Possibilities B Feasible but Inefficient Frontier Efficient Points 1,000 Quantity of Cars Produced 700 0 300 600 1,000
Supply Equilibrium Demand Second PictureSupply and Demand Price of Ice-Cream Cone $3.00 2.50 2.00 1.50 1.00 0.50 Quantity of Ice-Cream Cones 0 1 2 3 4 5 6 7 8 9 10 11 12
$2.50 New equilibrium 2. ...resulting in a higher price... D2 10 3. ...and a higher quantity sold. An Increase in Demand Price of Ice-Cream Cone 1. Hot weather increases the demand for ice cream... Supply 2.00 Initial equilibrium D1 0 7 Quantity of Ice-Cream Cones
S2 $2.50 2. ...resulting in a higher price... 3. ...and a lower quantity sold. A Decrease in Supply Price of Ice-Cream Cone 1. An earthquake reduces the supply of ice cream... S1 New equilibrium 2.00 Initial equilibrium Demand 10 0 1 2 3 4 7 8 9 11 12 13 Quantity of Ice-Cream Cones
$5 1. A 22% increase in price... 4 Demand 50 100 2. ...leads to a 67% decrease in quantity. Elastic Demand: Quantity demanded responds dramatically to price Elasticity is greater than 1 Price Quantity
Supply $5 1. A 22% increase in price... 4 100 110 2. ...leads to a 10% increase in quantity. Inelastic Supply: Quantity doesn’t respond much to priceElasticity is less than 1 Price Quantity
Consumer Surplus and Producer Surplus Price A D Supply Consumer surplus Equilibrium price E Producer surplus Demand B C 0 Quantity Equilibrium quantity
Efficiency of Competitive Market Equilibrium … and the Tax Wedge Price Supply Value to buyers Cost to sellers Cost to sellers Value to buyers Demand 0 Quantity Equilibrium quantity Value to buyers is greater than cost to sellers. Value to buyers is less than cost to sellers.
Remember MR = MC and market price is the marginal revenue of a price-taking competitive firm MR = P = MC
Price of Steel Deadweight loss D F The Effects of a TariffDeadweight Loss Domestic supply A B Price with tariff C E Tariff Price without tariff World price G Imports with tariff Domestic demand Q1S Q2S Q2D Q1D 0 Quantity of Steel Imports without tariff
GDP: Real and Nominal • Gross Domestic Product (GDP): the marketvalue of all finalgoods and services produced within a country during a year. GDP = C + I + G + Ex – Im = C + I + G + NX • Real GDP adjusts for inflation Nominal GDP = $GDP = P x Q $ GDP = GDP Deflator x Real GDP Real GDP = Q = $GDP/P = Nominal GDP divided by (deflated by) the GDP Price Deflator
Foreign Exchange Rate: Appreciation and Depreciation • A currency appreciates when it buys more of a foreign currency. • Appreciation makes foreign goods cheaper. • Appreciation Imports Up and Exports Down. • A currency depreciates when it buys less of a foreign currency. • Depreciation makes foreign goods more expensive. • Depreciation Imports Down and Exports Up.
Current Account vs. Financial Account • The balance of payments must balance Current Account + Financial Account = 0 • If we buy more goods and services from foreigners than they buy from us, we have to borrow the difference sell them our IOUs. Capital inflows help finance domestic investment and the government’s deficit
Interest Rates: Nominal and Real • Nominal Interest Rate (i): the interest rate observed in the market. • Real Interest Rate (r): the nominal rate adjusted for inflation (). Real Interest Rate = Nominal Interest Rate – Inflation Rate r = i - • Low real interest rates spur business investment spending (the I in C + I + G + NX)
Imports and Exports The demand for imports depends on current economic activity, YIM = IMa + mpi Y • “mpi” is the marginal propensity to import • Exports are exogenously determined • they depend on conditions in foreign economies, not our economy • Net exports is NX = EX – (IMa + mpi Y) orNX = NXa – mpi Y • Net expects decrease as the economy expands
Demand-Side Equilibrium and the MultiplierAt equilibrium: Y = C + I + G + NX = AEIncrease in Y = Spending Multiplier x {Increase in Autonomous Spending}Multiplier = 1/(mps + mpi)