Download
1 / 22
220 likes | 238 Views
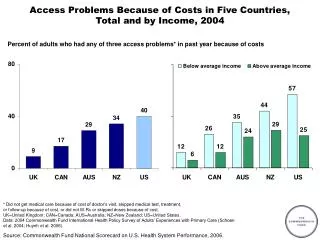
Explore the 2019 Scorecard on State Health System Performance, revealing insights on coverage, costs, and regional disparities in health outcomes. Discover key findings and data on deaths from suicide, alcohol, and drugs.

E N D
Results from the 2019 Scorecard on State Health System Performance www.commonwealthfund.org Media teleconference: June 11, 2019 Embargoed until 12:01 am, June 12, 2019
Results from the 2019 Scorecard on State Health System Performance Online interactive report Printable Version Exhibit 2
Key Findings from the Scorecard Exhibit 3 Deaths from suicide, alcohol, and drugs are a national crisis, but affect states in different ways • States in New England, the Mid-Atlantic, and a number of Southeastern states have been hard-hit by the opioid epidemic • Several western and plains states had higher rates of death from suicide and alcohol use than from drugs in 2017 States’ progress in expanding health care coverage and access since the Affordable Care Act (ACA) was enacted has stalled • 16 states experienced small upticks in their adult uninsured rate between 2016 and 2017 Health care costs are the primary driving force behind rising premiums, which are an increasing financial burden to working families in all states. • per-enrollee spending growth in employer plans grew faster and was more variable across states than per beneficiary spending in Medicare
Hawaii, Massachusetts, and Minnesota lead the nation Better performance U.S. average Worse performance Exhibit 4 States are arranged in rank order from left (best) to right (worst), based on their overall 2019 Scorecard rank.
Eight states are leaders in their own regions Great Lakes Mid-Atlantic New England Southeast Rocky Mountains Plains Southwest Top state in each region West Better-than-average states in each region Worse-than-average states in each region Exhibit 5
Deaths from suicide, alcohol, and drug overdose impact states differently (deaths per 100,000 in 2017) Drug overdose Suicide Alcohol Deaths per 100,000 in 2017 Deaths per 100,000 in 2017 Deaths per 100,000 in 2017 8.1–13.8 (13 states) 5.5–7.9 (14 states) 6.6–13.6 (12 states) 14.4–29.4 (26 states) 13.8–19.1 (26 states) 8.2–11.8 (24 states) 13.4–30.6 (12 states) 30.0–57.8 (11 states) 20.1–28.9 (12 states) Note: D.C. not counted in state tallies. Data: 2005–2017 National Vital Statistics System (NVSS), via CDC WONDER Exhibit 6
Drug overdose deaths unequal across states, disproportionately impact Pennsylvania, Ohio and West Virginia Deaths per 100,000 Low-rate states West Virginia Ohio Pennsylvania U.S. Notes: ‘Low-rate’ refers to the median value among the group of states with rates below the U.S. average. Data: 2017 National Vital Statistics System (NVSS), via CDC WONDER Exhibit 7
Deaths from suicide, alcohol, and drug overdose on the rise, 2005-2017 Cumulative increase 2005–2017 Deaths per 100,000 Drug overdose 115% Suicide 28% Alcohol 37% Data: 2005–2017 National Vital Statistics System (NVSS), via CDC WONDER Exhibit 8
Drug overdose deaths up more than 300% in Ohio, Delaware and West Virginia Percent change 2005 - 2017 West Virginia Lower growth states Delaware Ohio U.S. Notes: ‘Lower growth’ refers to the median value among the group of states with growth rates below the U.S. average. Data: 2005–2017 National Vital Statistics System (NVSS), via CDC WONDER Exhibit 9
Growth in deaths from suicide, alcohol, and drug overdose differ across states Drug overdose Suicide Alcohol Percent change 2005–2017 Percent change 2005–2017 Percent change 2005–2017 16%–47% (13 states) 3%–48% (27 states) 3%–48% (44 states) 53%–86% (10 states) 52%–87% (6 states) 51%–96% (22 states) 100% or more (0 states) 119% (1 state) 107%–450% (26 states) Exhibit 10 Note: Growth is measured as the percent change in deaths per 100,000 between 2005 and 2017. D.C. not counted in state tallies. Map categories are fixed for all three death causes at 0-49% increase, 50-99% increase, and 100% or more increase. (*) Only D.C. had a negative growth rate; all states had growth rates of at least 3%. Data: 2005–2017 National Vital Statistics System (NVSS), via CDC WONDER
Cost barriers to receiving care fell as uninsured rates fell following ACA coverage expansions Less than 10% 10%–14% 15% or more Uninsured adults Adults who went without care because of costs 2013 2014 2015 2016 2017 Notes: Adults who went without care is limited to persons age 18-64 in this exhibit, thou the Scorecard ranks states on a version of this measure that includes all adults age 18 and older. Data: Uninsured (ages 19–64): U.S. Census Bureau, 2013–2017 One-Year American Community Surveys. Public Use Micro Sample (ACS PUMS); Cost barriers (ages 18–64): 2013–2017 Behavioral Risk Factor Surveillance System (BRFSS). Exhibit 11
Five of the 17 states that have yet to expand Medicaid had the highest adult uninsured rates in 2017 Percent Medicaid expansion states as of January 1, 2017 24% Non-Medicaid expansion states as of January 1, 2017 4% Note: ME and VA passed and implemented expansion after 1/1/2017. NE, UT, and ID passed ballot initiatives to expand Medicaid but have not yet implemented a full expansion. Data: U.S. Census Bureau, 2017 One-Year American Community Surveys. Public Use Micro Sample (ACS PUMS). Exhibit 12
The share of adults ages 18-64 who skipped needed care because of costs up in a dozen states, eroding earlier gains Percent 2017 States with an Increase* States with little or no change 2016 Note: States are arranged in rank order based on their 2016 value. (*) rate increase refers to change between 2016 and 2017 of at least 2 percentage points. Adults who went without care is limited to persons age 18-64 in this exhibit, though the Scorecard ranks states on a version of this measure that includes all adults age 18 and older. Data: 2016 and 2017 Behavioral Risk Factor Surveillance System (BRFSS). Exhibit 13
Average employee health insurance contributions were 8 percent of median income or more in 11 states, 2017 Average employee share of premium as percent of median state incomes 4.8%–5.9% (16 states + D.C.) 6.0%–7.7% (23 states) 8.0%–10.2% (11 states) Source: Employee premium share: Medical Expenditure Panel Survey–Insurance Component (MEPS-IC, 2017); Median household income: Current Population Survey (2017-18). Exhibit 14
Higher premiums for employer coverage is associated with higher per person spending, 2016 State values U.S. Average Average premiums for employer coverage r = 0.74 Average per enrollee spending among individuals with employer coverage Note: X- and Y-axes do not start at $0. Abbreviations left off some states clustered near the U.S. average for legibility Data: Employer coverage per enrollee spending - 2016 Truven MarketScan Database, analysis by M.Chernew, Harvard Medical School. Medical Expenditure Panel Survey–Insurance Component (MEPS-IC, 2017) Exhibit 15
Price increases drive total spending growth Cumulative change in per person spending, utilization, average price, 2013-2017 Total Spending Service Use Price +29% +25% +19% +19% +17% +17% +16% +12% +13% +10% +3% +<1% -<1% -5% Total Inpatient Outpatient Professional Services Rx Drugs Exhibit 16 Note: The data on this chart come directly from the Healthcare Cost Institute (HCCI), and are not factored into the Scorecard rankings. The 2017 Health Care Cost and Utilization Report examines medical and prescription drug spending, utilization, and average prices, and is based on health care claims data from 2013 through 2017 for Americans under the age of 65 who were covered by employer-sponsored insurance (ESI). Utilization and average prices account for changes in the type or intensity of services used, with the exception of prescription drugs. Prescription drug spending is the amount paid on the pharmacy claim, which reflects discounts from the wholesale price, but not manufacturer rebates. Source: Healthcare Cost Institute, 2017 Healthcare Cost and Utilization Report. Available here: https://www.healthcostinstitute.org/images/pdfs/HCCI_2017_%20Health_%20Care_Cost_and_Utilization_Report_02.12.19.pdf
Cumulative growth in per-enrollee spending among adults with employer insurance out-paced per capita Medicare spending growth Medicare Employer insurance Plains Mid-Atlantic New England Great Lakes West Southwest Southeast Rocky Mountain Data: Employer coverage - 2016 Truven MarketScan Database, analysis by M.Chernew, Harvard Medical School. Medicare, 2016 administrative claims via May 2018 CMS Geographic Variation Public Use File. Exhibit 17
Summary and Implications Exhibit 18 Improvement is possible, progress on many measures would benefit from state and federal partnerships Expanding coverage and access to care • Medicaid expansion is associated with lower uninsured rates • Placing limits on Medicaid eligibility will further erode coverage; • State and federal policies (e.g. reinsurance programs) can lower premiums in the individual market. Mitigating spending growth • State and federal value-based paymentprograms link provider payment to patient outcomes; • State and federal efforts to set prices paid by private insurers closer to Medicare rates. Addressing the opioid crisis • Improving access to opioid overdose-reversal medications like naloxone • Establishing guidelines and limits for opioid prescribing.
For More Information, Visit the Fund’s new Health System Data Center: http://datacenter.commonwealthfund.org/ Exhibit 19
Interactive tools & sub-population analysis State-specific downloadable content Exhibit 20
State Health System Scorecard Methods Exhibit 21 Goal: to provide benchmarks and trends to inform national, state and local action to improve health care system performance Health System Focus: Builds on previous Scorecards • 47indicators organized into 4 dimensions:Access/affordability; Prevention/treatment; Avoidable hospital use and costs; and Healthy lives • Disparity dimension assesses a subset of indicators by income within states • National data sources including administrative claims, national surveys, and vital statistics available for states 2- to 3-year trend data available for 45 indicators • Generally from 2013 to 2017, but varies by indicator Scoring: • Each indicator is ranked based on standardized (z- ) score • Dimension rank is based on average of indicator standardized scores • Overall rank based on average of five dimension standardized scores Estimated gains are based on rates of performance in the top performing state
2019 Scorecard Indicators Exhibit 22