Download
1 / 56
560 likes | 772 Views
Update on hypertension - diagnosis, monitoring and guideline treatment targets Prof. Richard McManus, Birmingham, United Kingdom. Overview . Background Routine measurement of blood pressure (is rubbish) Diagnosis of hypertension - ABPM? Management of hypertension – Home ?

E N D
Update on hypertension - diagnosis, monitoring and guideline treatment targets Prof. Richard McManus, Birmingham, United Kingdom
Overview • Background • Routine measurement of blood pressure (is rubbish) • Diagnosis of hypertension - ABPM? • Management of hypertension – Home ? • Treatment targets – any changes? • Conclusions
Stroke Risk increases with age & usual BP High 60-69 Similarly for Heart Disease 40-49 Risk Low High Low
Bottom line BP vs Risk 10 mmHg 38% stroke risk 18% CHD risk
The population is ageing In mid-2008 the median age of the population was 39 years, up from 37 in 1998.
Routine measurement is often flawed Same population with routine and research measurement
Blood Pressure varies through the day and between seasons Hypertension. 2006;47:155-161
This variability means that measurement error can drown out the truth
Approx 1500 patients 24 practices 6 readings at 1min intervals 12 mmHg systolic drop Stable after 5th reading Even on a single occasion BP drops
Family Practice 1997; 14:130-135 BP takes some time to settle with repeated measurement over weeks/months
Many factors affect BP measurement BMJ 2001;322;908-911
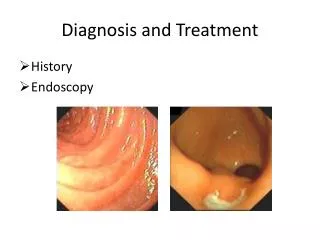
Diagnosing hypertension • Traditionally based on clinic measurement • Most outcome trials use clinic measures • But • Flawed measure (one off from continuum) • Takes weeks / months to make diagnosis
What about ABPM? • Half hourly measurements during the day • Better measure usual BP • Hourly at night • Main outcome is mean day time ABPM • Other info available (dipping etc)
International Thresholds for hypertension diagnosis (clinic and ABPM) Mean daytime BP UK (ABPM) = 135/85 mmHg
What’s normal for ABPM (and home)? Based on Head et al BMJ 2010 • adjust by 5/5 mmHg at lower threshold (stage 1 hypertension, 140/90 mmHg clinic) • ie < 135/85 mm Hg • 10/5 mmHg at higher threshold (stage 2 hypertension, 160/100 mmHg clinic) • Ie < 150/95 mmHg
How do clinic and ABPM compare? • Reviewed literature: 2914 studies of which 20 were relevant • 7 compared ABPM with clinic monitoring for diagnosis • Full details: BMJ 2011;342:d3621 doi: 10.1136/bmj.d3621
Many people currently potentially misdiagnosed... Worse if only studies around diagnostic threshold used: sensitivity of 86% and specificity of 46%
What about Home Monitoring? Relative sensitivity and specificity of clinic and home measurement vs ABPM
Better correlation with end organ damage and outcome (ABPM) 1963 patients Mean FU 5 yrs Baseline ABPM CVD events
Better correlation with end organ damage and outcome (Home) 1700 patients, 10 years FU, 150 CVAs Screening = 2 clinic measurements one occasion Home = 25 measurements over 4 weeks Journal of Hypertension 2004, 22:1099–1104
But what about costs? • Treatment – ↓drug costs • Follow up – ↓clinician costs • But do additional costs of ABPM out weigh these?
Is ABPM cost effective? • Modelling to evaluate the most cost-effective method of confirming a diagnosis of hypertension in a population suspected of having hypertension • ABPM vs Home vs clinic • Further details Lovibond et al, Lancet 2011
Markov Model • Health service perspective • Lifetime horizon • Assume all have raised clinic screening • People aged 40 and over
Markov Model • Costs from published sources and NHS • Test performance from systematic review • Risk calculated using Framingham equation
Results • ABPM most cost effective for every age group
Results • ABPM most cost effective for every age group • Robust to wide range of sensitivity analyses
Results • ABPM most cost effective for every age group • Robust to wide range of sensitivity analyses • Sensitive to • Assumption of equal test performance • Assumption of no effect of Rx below 140/90 mmHg
ABPM • Don’t forget ABPM need to be validated and have yearly calibration (bhsoc.org.uk website) • Lack of night time dipping is additional risk (hence rationale for night readings) • Currently limited in PC as most practices either need to refer or only have one ABPM machine • Commissioners need to consider whole health economy
Self Monitoring reduces BP • Small reductions in blood pressure from self-monitoring: • SBP by 3.8 mmHg • DBP by 1.5 mmHg Bray et al. Annals of Medicine 2010
Self monitoring costs equivalent to usual care BMJ 2005;331;493
How many measurements? Conclusion = at least 4 days monitoring and discard 1st European (& UK) Guideline is 1 week, 2 readings bd, discard day 1, take mean (limited rationale)
What is the place of home monitoring? • Management after diagnosis, especially if proven significant white coat effect • More outcome and test performance data needed for diagnosis • Adjunct to other co-interventions and self management...
Co-interventions enhance self monitoring effect 2.5 mmHg 5.3 mmHg
What’s a co-intervention? • Nurses • Telemonitoring • Patient Education • Self Management
Theoretical basis for self management Patients • Increased patient involvement in management decisions will result in: Cues to action Adherence Increased self efficacy Behaviour change • Better use of medication likely to have most effect Professionals • Systematic titration of medication effective • Evidence of clinical inertia
TASMINH2 TASMINH2 Research Questions Does self management with telemonitoring and titration of antihypertensive medication by people with poorly controlled treated hypertension result in: • Better control of blood pressure? • Changes in reported adverse events or health behaviours or costs? • Is it achievable in routine practice and is it acceptable to patients?
TASMINH2 The Trial • Eligibility • Age 35-85 • Treated hypertension (no more than 2 BP meds) • Baseline BP >140/90 mmHg • Willing to self monitor and self titrate medication • Patients individually randomised to self-management vs usual care stratified by practice and minimised on sex, baseline SBP, DM status, • Practice GPs determine management
TASMINH2 Intervention • Self Monitoring – 1st week of every month
Intervention • Blood Pressure Targets: • NICE (140/90 or 140/80 mmHg) • minus 10/5 mmHg i.e. 130/85 mmHg or 130/75 mmHg • Patients agreed titration schedule with their GP after randomisation • Traffic Light system to adjust medication
TASMINH2 Outcomes • Follow up at 6 & 12 months • Main outcome Systolic Blood Pressure • Secondary outcomes: Diastolic BP / costs / anxiety / health behaviours/ patient preferences / systems impact • Recruitment target 480 patients (240 x 2) • Sufficient to detect 5mmHg difference between groups
Invited (n = 7637) Declined Invitation (n = 5987) Assessed for eligibility (n = 1650) Excluded(n = 1123) Not Eligible (n = 1044) Declined to participate (n=79) Randomised (n = 527) Control (n = 264)Received usual care (n = 264) Intervention (n = 263)Received intervention training (n = 241) Did not attend follow up (n=14)* Discontinued usual care (n = 0) Did not attend follow up (n=26)# Discontinued intervention (n = 53) Analysed (n = 246) Incomplete cases excluded (n = 18) Analysed (n = 234) Incomplete cases excluded (n = 29) Results 110% recruitment 80% completed intervention 91% follow up
TASMINH2 Baseline Results
TASMINH2 Results - primary outcome SBP
TASMINH2 Results – secondary outcomes DBP
TASMINH2 Results - subgroups