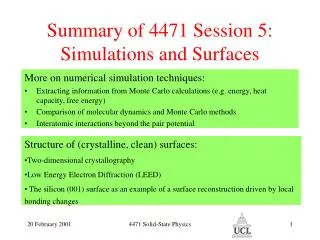
Download
1 / 32
340 likes | 594 Views
Secondary Fluorescence Corrections for EPMA: Using PENELOPE Monte Carlo Simulations. John Fournelle*, Justin Gosses*, Jacques Kelly*, Kathy Staffier*, Jeff Waters**, and Caroline Webber*.

E N D
Secondary Fluorescence Corrections for EPMA: Using PENELOPE Monte Carlo Simulations John Fournelle*, Justin Gosses*, Jacques Kelly*, Kathy Staffier*, Jeff Waters**, and Caroline Webber* * Department of Geology and Geophysics, University of Wisconsin, Madison, Wisconsin 53706 ** Department of Material Science and Engineering, University of Wisconsin, Madison, WI 53706
15 keV FeTiO3 FeTiO3 Fe3O4 3 microns Background: The primary volume of x-rays generated is relatively small (~a few microns), dependent on keV and material composition. There are several Monte Carlo programs that provide good estimates of this primary volume. Example using CASINO
15 keV Ti Ka Ti Ka Bremstrahlung Fe Ka FeTiO3 FeTiO3 Fe3O4 3 microns However … The x-rays generated in the primary volume can easily travel far outside the original material’s volume — producing SECONDARY FLUORESCENCE (SF) in a different material. The detector will register those SF x-rays as coming from the primary excitation volume.
We had a problem… in a specimen in Nb-Pd-Hf-Al bearing phases • Some researchers claimed 10 wt% Nb in 2 phases where our PI suggested Nb should be absent. • The other researchers did EPMA by EDS at 30 keV, measuring Nb Ka. • But our lab measured NbLa (WDS at 18 keV) and got ~0 wt% Nb.
But there was a small Nb Ka peak! We checked out the phase (Pd2HfAl) we found to have zero Nb in, acquiring an EDS spectrum (at 28 keV).
First thought: • Secondary fluorescence might explain the discrepancy, as • problematic phases just a short distance from Nb phase • Pd Ka x-rays strong enough to excite K edge of Nb But can we prove it?
Pd2HfAl (no Nb) Nb 2 ways to address the problem Experimentally: Create a ‘non-diffused couple’ of Nb against Pd2HfAl, and measure the Nb Ka with distance away from the boundary. (special LIF220 crystal needed for WDS). --The data were consistent with secondary fluorescence.
2. But while waiting to get LIF220 installed on our electron probe, we learned about the PENELOPE program - which we discovered had been shown to successfully reproduce Secondary Fluorescence. We acquired a copy of PENELOPE, and began to learn how to run it… on both a WinPC and under MacOS X, using easily accessible G77 compilers.
It wasn’t as easy as running snazzy GUI-front ended programs … …but with a little perserverance it became fairly easy. … 5 grad students, some with no programming or command line experience, quickly learned how to run it on their laptops.
We started with a simple geometry and the default Penelope detector … And reproduced the Nb-Pd2HfAl non-diffused couple data fairly well, but found some slight differences. Annular detector
We set up two distinct models: one with the Nb side facing the detector, the other 180° away -- there was ~40% difference!
->40% more secondary fluorescence yield of Nb if Nb side faces the detector ->Absorption path may be important: higher mac for Nb Ka thru the Pd2HfAl (57) vs thru Nb (20) This confirmed Secondary Fluorescence as the problem – and showed that PENELOPE is a good tool for simulating the effects of SF.
As an EPMA class project, UW-Madison, students simulated various models of interest with PENELOPE on their personal computers.
z x y Fall 2004 PENEPMA - Model used: Annular detector only Non-diffused couple
Fe Diffusion in Cu inclusions? Cu particle Cu in most stony meteorites occurs as 1-20 mm grains associated with troilite (FeS) and NiFe. NiFe Duke and Brett (1965) considered the concentration of Fe in 10-20 mm Cu grains in a stony meteorite. Their EPMA measurements gave 1-4 wt%. Cu formed @ 475°C in equilibrium with Fe has <0.2 wt% Fe in solid solution. Secondary fluorescence??? (Their EPMA conditions: 25 keV, TOA 52.5° on ARL probe. We calculate Cu Ka x-ray range as <1.5 mm)
Fe Diffusion in Cu PENELOPE simulates 1 wt.% Fe in Cu at 10 mm away from pure Fe. A 10 mm (dia.) sphere could show 2 wt% Cu. If you are interested in trace levels, SF yields 34 ppm Fe at 100 microns away from the Fe material. PENELOPE allows simulating any takeoff angle (here 52.5°) and keV (25) This simulation matches closely recent experimental work (Llovet and Galan, 1996).
Trace level of Ti and Al in Quartz EPMA many times used to measure some trace element concentrations in minerals. … one example is quartz Possible problem: SF of Al or Ti-rich phases either within or adjacent to quartz (e.g. rutile needles in quartz). 20 keV, 40° takeoff angle; electron range in quartz 3-4 microns
“Ti” in Quartz if there is nearby rutile TiO2 SiO2 The 2 curves represent different paths out of the sample to the detector (different mass absorption values.) It is clearly possible to get 500-1200 ppm of apparent Ti within 30 microns of the interface. This is all from continuum x-ray excitation (E0 = 20 keV).
“Al” in Quartz near corundum Al2O3 SiO2 PENELOPE suggests that you need to be at least 10 microns away from a lateral Al-rich phase to be certain that SF producing less than 100 ppm of apparent Al. A worst case scenario would be 500 ppm of Al at 5 microns distance.
Olivine Fo90 Plag An80 (no Ca) but 7.6 wt% Fe (no Fe) but 11.7 wt% Ca Adjacent olivine and plagioclase What SF can do…for trace levels of Ca in olivine and of Fe in plagioclase 15 keV, 40° take off angle
Trace level of Ca in olivine Plag An80 Olivine Fo90 Secondary fluorescence can easily boost the Ca content particularly within 25 microns of rim adjacent to Ca-bearing phases.
Correction for secondary fluorescence clinopyroxene Olivine Fo90 Llovet and Galan (2003) showed the correction for Ca in olivine adjacent to clinopyroxene using PENELOPE simulation:
Trace level of Fe in plagioclase Plag An80 Olivine Fo90 EPMA analyses of plagioclase normally have several tens of wt.% FeO. How much is due to secondary fluorescence? Fo90: 9.8 wt% FeO 7.6 wt% Fe PENELOPE provides the ability to evaluate and/or correct for secondary fluorescence.
Ca in orthopyroxene lamellae within clinopyroxene Interface 0 um -5 um +5 um Coexisting compositions of ortho- and clinopyroxenes are used as a geothermometer. There is only a small amount of Ca in orthopyroxene; we decided to see if PENELOPE could tell the potential for error in Ca content of thin opx lamellae, and the resulting error in temperatures.
Additional Ca from secondary fluorescence of adjacent cpx PENELOPE SIMULATION
IMPACT ON GEOTHERMOMETRY PENELOPE SIMULATION
z Sample = 10 um polished sphere embedded in plastic Standard = 2 mm polished sphere Cr2O3 PMM (plastic) Difference between small sample and large standard In troubleshooting low totals, the question arose: if there is a several order magnitude size difference between unknowns (small grain separates) and standard (large), what could result?
z Sample = 10 um polished sphere embedded in plastic Standard = 2 mm polished sphere Cr2O3 PMM (plastic) Is the lack of “additional” Cr x-ray counts resulting from secondary fluorescence of any importance???
z Sample = 10 um polished sphere embedded in plastic Standard = 2 mm polished sphere Cr2O3 PMM (plastic) Set up a PENELOPE simulation: Standard of “huge size”, 2 mm Unknowns of much smaller size Accelerating voltage of 20 keV, TOA 40 degrees
4 Yes, Secondary Fluorescence can cause problems Standard=2000 mm Cr2O3 Unknown = smaller Cr2O3 Electron range (K-O): 1.7 micron Cr Ka X-ray range (A-H): 1.6 micron A 100 mm grain of pure Cr2O3 will have 1% low Cr K-ratio, and a 10 mm grain will have a K-ratio 2.5% low.
New PENELOPE geometries More realistic geometries are now available
Conclusion Secondary fluorescence across phase boundaries has been a difficult issue to address in the past. PENELOPE provides a powerful tool to evaluate, and correct, this secondary fluorescence.